Developed by famous technician J.Welles Wilder Jr., the Parabolic SAR, also known as the parabolic stop and reverse, is a popularly used indicator. It is mainly used by traders for determining the short-term momentum of any given asset. It can easily be applied to any trading strategy, enabling the trader in determining where stop orders should be placed. The calculations involved with this indictor is complex.
The parabolic SAR works with the assumption that a trader is fully invested in a position at any given point in time. Thus, traders who wish to always have money in the market, and those who develop trading systems, tend to prefer this indicator over others.
Parabolic SAR in Trading
If we plot the Parabolic SAR on an asset chart, it is generally denoted by a series of dots, placed either below or on top of the price. This depends on the asset’s momentum. For instance, a dot is placed above the price when the trend of an asset is downward. Consequently, it is placed below the price when the trend of the asset is upward. Transaction signals are usually generated when the dots are placed on the opposite side of the price after they reverse their direction.
Since using indicator by itself can often lead to traders entering or exiting a position prematurely, traders usually place their stop-loss orders at the SAR value. This is done because a reversal is signalled when the trader moves beyond this, which in turn causes the trader to anticipate a move in the opposite direction. To prevent the trader from being stopped out of positions on temporary replacements, the parabolic SAR is usually removed from the price during a long-term trend. This enables the traders to gain substantial profits by riding the trend for a longer period of time.
Parabolic SAR Markets
Markets with a steady trend are ideal for Parabolic SAR. The parabolic SAR tends to whipsaw back and forth when in ranging markets, which generates false trading signals. Thus it is recommended that traders use the average directional Index or ADX, which is a momentum indicator along with the parabolic SAR. This helps them obtain a more accurate assessment of the existing trend’s strength.
Additionally, traders may also use candlestick patterns or moving averages along with the parabolic SAR. For instance, when the price falls below a major moving average, traders can take this as a separate confirmation of a sell signal, previously indicated by the parabolic SAR.
Reading the Parabolic SAR Chart
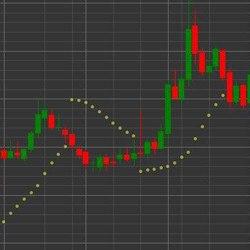
Even though the parabolic SAR is not technically an oscillator; the indicator is often used alongside other oscillators. The parabolic dots can easily be interpreted with each point representing a potential reversal in price behavior.
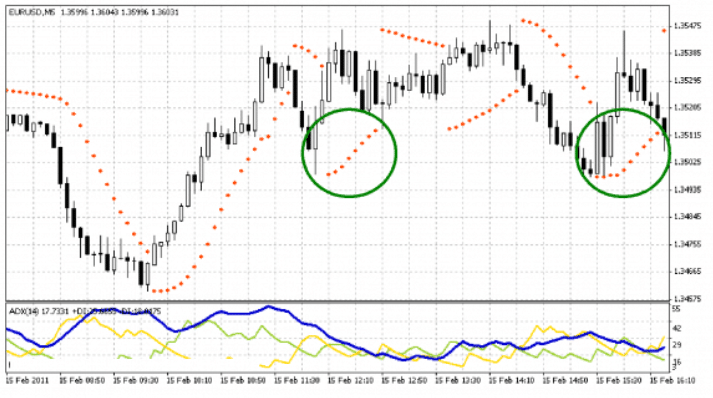
In the chart above (MT4), the parabolic SAR is depicted with a series of red dots for the EUR/USD pair. A major down and uptrend is occurring in the beginning of the chart, which is followed by a sideways choppy movement.
Here, the “switchover” points above and below the candlesticks are the key points of reference. When using the Parabolic SAR, it is recommended to use the ADX indicator as well to get the measure of the strength of the prevailing trend. On the chart, the ADX readings for both the initial trends are above 40, which indicates that strong trends are in place. However, it is also seen that two false SAR signals are produced in the green circles during the choppy portion of the market. It is also accompanied by weak ADX values.
Thus, it is to be noted that the parabolic SAR by no means can ever be 100% correct. Ranging price behaviours can produce false signals. However, the positive signals are consistent and give the trader a definite edge.
It requires a lot of skill and experience to interpret and understand the SAR signal. Traders usually develop this skill over time and should always be used with the ADX indicator.
Using the Parabolic SAR
The parabolic SAR is pretty easy to use. As indicated in the chart below, the dots above the candles signal a Buy signal, while the dots below the candles signal a sell signal.
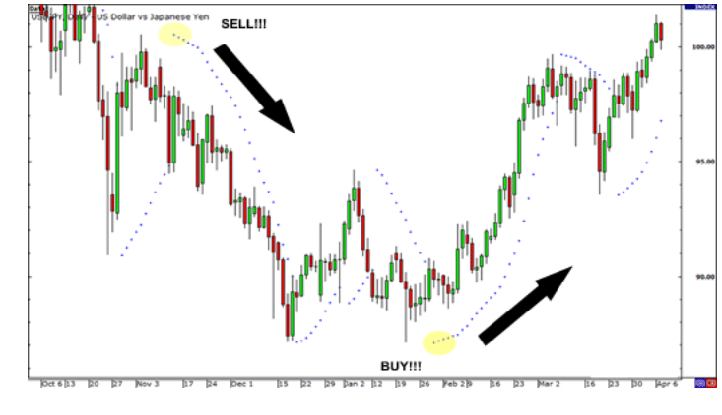
Since the parabolic SAR assumes the price is either going up or down, it is one of the easiest indicators to interpret. It is best used in the market that have long allies and downturns and is trending.
Exiting Trades Using Parabolic SAR
The parabolic SAR can also be used by the trader to help determine whether they should close a trade or not. To explain this, we will take the example of the daily chart of the EUR/USD currency pair.
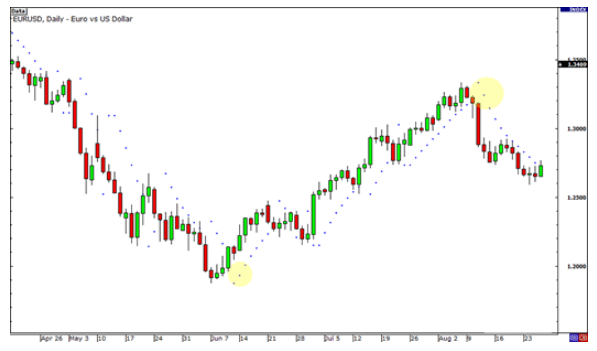
In the above chart, we can see when the EUR/USD pair starts to slide down, which is anticipated to just keep dropping. Traders who short this pair usually do not know how far low the pair would continue. In June, it is suggested that the downtrend is over after thee dots form at the bottom of the price. This indicates that the time is right for the trader to exit the shorts.
On the other hand, if the trader decides to hold on to the trade, anticipating that the pair would drop further, he/she can erase all the winnings they have made. This is because the pair eventually climbs back near the 1.35 level.
Conclusion
The Parabolic SAR is one of the indicators that are regularly used to track trends. It also serves as a guide for traders for placing their stop loss to either protect the profit associated with their trades or to limit the downside. Additionally, Parabolic SAR’s dot configuration has a similar function as the adjustment of a trailing stop.
Thus, the parabolic SAR is tailored to a wide variety of time frames, allowing traders to apply a stop and reverse strategy to much shorter as well as longer time frames. The general principle of the indicator remains the same across all timeframes, provided that the trader is operating in a market that is genuinely trending.


Leave a Reply