Oscillator indicators are some of the best forex indicators commonly used to time entry and exit points while trading in the capital markets. Technical analysts, as well as forex expert advisors, deploy these indicators to ascertain overbought and oversold market conditions.
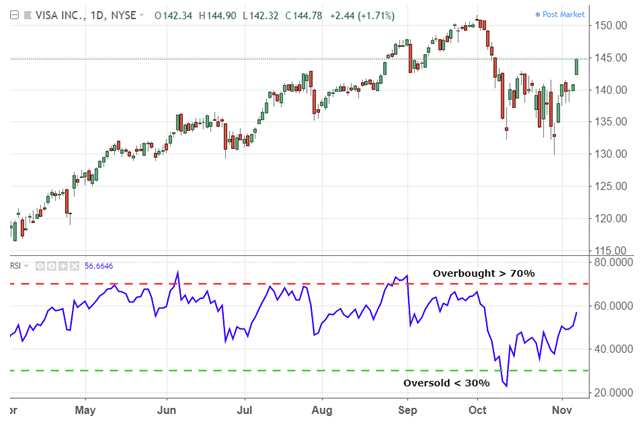
Oscillator indicators come with values that indicate two extreme levels. The Relative Strength Index or the stochastic oscillators, for instance, have readings of between 0 and 100.
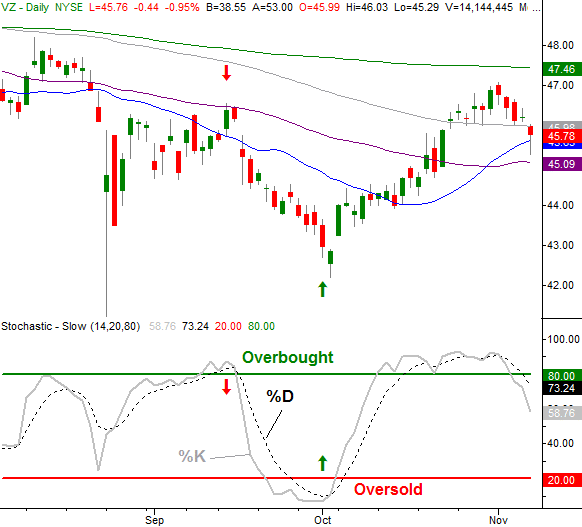
Readings below 30 indicate oversold conditions in RSI indicator while readings above 70 affirm overbought market conditions. For the Stochastic indicator, readings of 80 and above indicate overbought while below 20 affirm oversold.
Likewise, forex robots, as well as technical analysts, use oscillator indicators to analyze chart patterns to identify overbought and oversold conditions. As one of the most important forex trading secret, forex oscillators should always be used with other forex trading instruments to make trading decisions
How to Reap the Rewards of Oscillator Indicator
Oscillators for Identifying Trends
Trading with the trend is an essential money-making hack in the forex market. Regardless of whether one is scalping or news trading, trading in the direction of the long term trend is a proven way of generating significant profits in the market.
Over the years, analysts, as well as expert advisors engaged in automated forex trading, have found indicators to be effective in finding a clear trend for an underlying asset under study. For instance, the Relative Strength Index oscillator will affirm an uptrend whenever its reading is above 50 and signal bearish market conditions whenever the reading is below 50 and extreme bearish conditions under 30.
Similarly, the stochastic indicator will signal an uptrend whenever its reading is above 50 and overbought conditions above the 80 band level. Conversely, a downtrend is associated with a stochastic oscillator reading of below 50 and oversold conditions in the lower band, below 20.
Oscillators For Identifying Divergence
Oscillators as forex trading instruments show the movement of price over time and the strength of the movements, be it on the upside or downside. Conversely, the likes of RSI and Stochastic Indicators help traders, as well as Algorithmic Forex Trading systems, identify where the price is likely to reverse from an underlying trend. Price reversal using oscillator’s indicators occurs in what is often referred to as divergence.
The relative strength index is one of the best forex charting tools for identifying potential price reversals in the market.
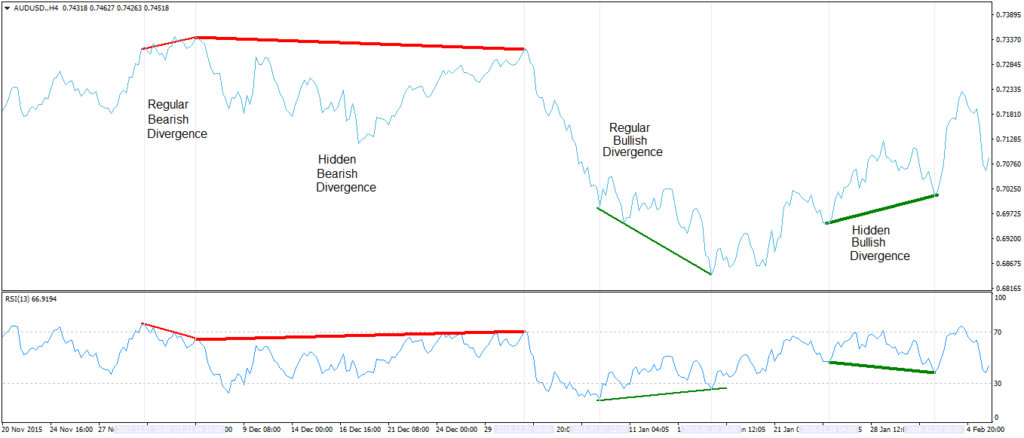
In this case, divergence occurs whenever the price of an asset is moving up, but the RSI indicator is moving downwards. If this was to happen, then it indicates momentum exhaustion, and that price is about to reverse downwards.
Likewise, divergence occurs when the price is moving downward, but the RSI indicator changes direction and starts to move upwards. In this case, the price would often reverse and start moving upwards in the direction of the RSI indicator, indicating bullish divergence.
Identifying Oversold and Overbought Conditions
Technical analysts, as well as FX Advisors, deploy oscillator indicators with the sole aim of identifying overbought and oversold market conditions. For instance, while using RSI or Stochastic oscillators, it becomes much easier to identify extreme price levels where price reversal is likely to happen.
In the case of the stochastic indicator, whenever price moves above the 80 level bands, the same is interpreted as overbought conditions. Traders, as well as automated FX trading systems, pay close watch to potential price reversal to the downside. Similarly, whenever price moves the 20 band level, the same is interpreted as oversold conditions, signaling that price might reverse and start moving upwards.
However, it is important to note that price might stay in overbought or oversold conditions much longer than anticipated.
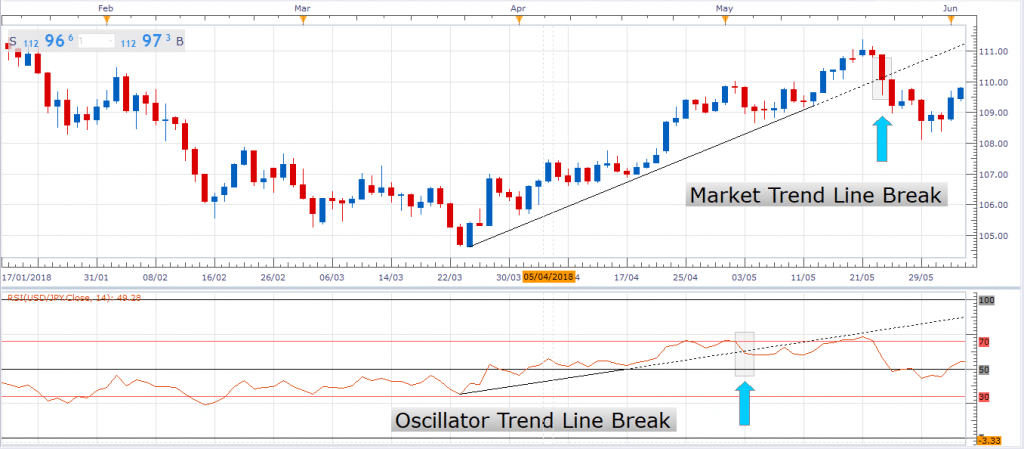
Oscillators for Continuation Patterns
Oscillator indicators are often used as continuation patterns helping affirm the direction of an emerging trend. For instance, whenever price reverses from oversold conditions, it is often expected that as the RSI indicator moves from below the 30 level, it will continue to move higher even on the RSI crossing the 50 level.
Once price crosses the 50 level in the RSI indicator, it signifies the strengthening of the upward trend with price expected to continue edging higher in continuation of the uptrend. Similarly, whenever price moves from overbought conditions, it is often expected to continue edging lower upon the RSI indicator crossing the 50 level signaling strengthening of the downtrend.
Bottom Line
Oscillator indicators are some of the best forex indicators for technical analysis. Oscillator indicators seek to provide a clearer picture of the market by identifying the underlying trend as well as signaling overbought and oversold market conditions. Similarly, they act as important forex trading tools for identifying divergence whereby the price is likely to reverse and start moving in the opposite direction.
Oscillator indicators stand out in part because they can be used regardless of whether the price is moving up or down or sideways. However, they should always be used with other forex charting tools for making informed decisions in the market.


Leave a Reply