
Oil has been exceptionally well since the March crash last year as the concerns about the spread of COVID-19 were intensifying.
Look at the weekly Brent oil chart below. When the market recovered from the first correction, oil prices broke out above 44.00 and never looked back, providing no meaningful correction since then.
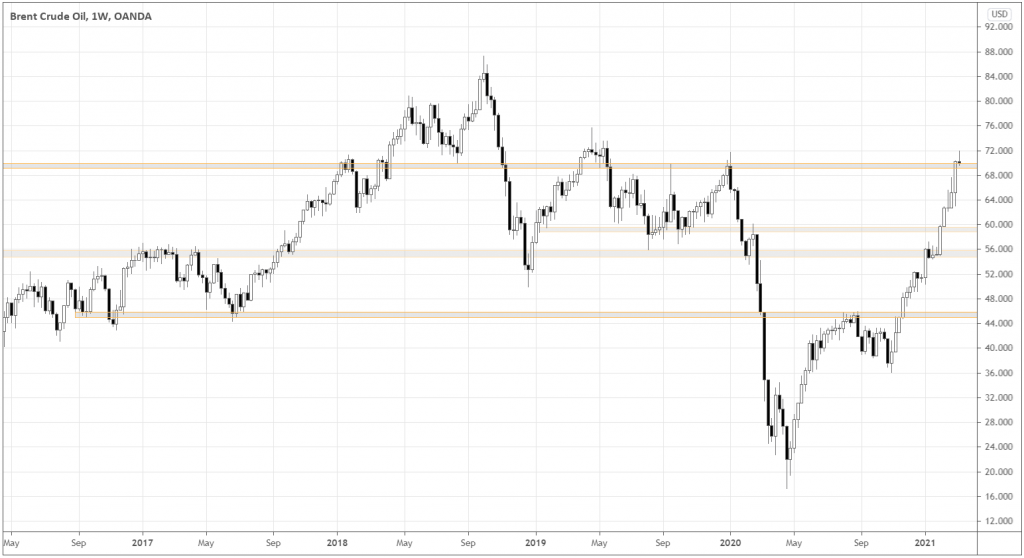
On its way up, the market has managed to break several major resistance levels – 56.00, 60.00, and recently the prices pinched above 70.0.
Notice that the distance between the newly tested resistance 70.0 and the potential congestion of buyers around 59.0 is roughly 50% of the move that started from the breakout of the 45.00 resistance level. It would be logical to see the first big-scope correction from the current levels to 59.00.
How to plan your trades in oil?
If the market holds above 70.0, there is no reason to be bearish on oil, as the seemingly “overextended” market can go much further than most would expect.
Traders can buy if the market keeps closing above 70.0 on a Daily timeframe with the initial stop below 69.00. As the upward move has been steep, a moderately tight trailing stop may be applied.
The ultimate target for a long trade is the 84.0-87.0 area near the 2018’s high.
At the same time, if we see more days closing below 70.0, we can consider shorting the oil in an attempt to catch a possible correction that may approach 59.00. The stop-loss above 72.00 would be appropriate.
Eat that missile!
The oil may be subject to more volatility these days as Saudi major oil port and Aramco residential area experienced the attack with a drone and a ballistic missile this morning. Fortunately, no one was injured, and the property didn’t suffer any damage.
In the four-hour chart below, we can see how the market reacted to the news. The circled candle represents the immediate reaction to the attack.
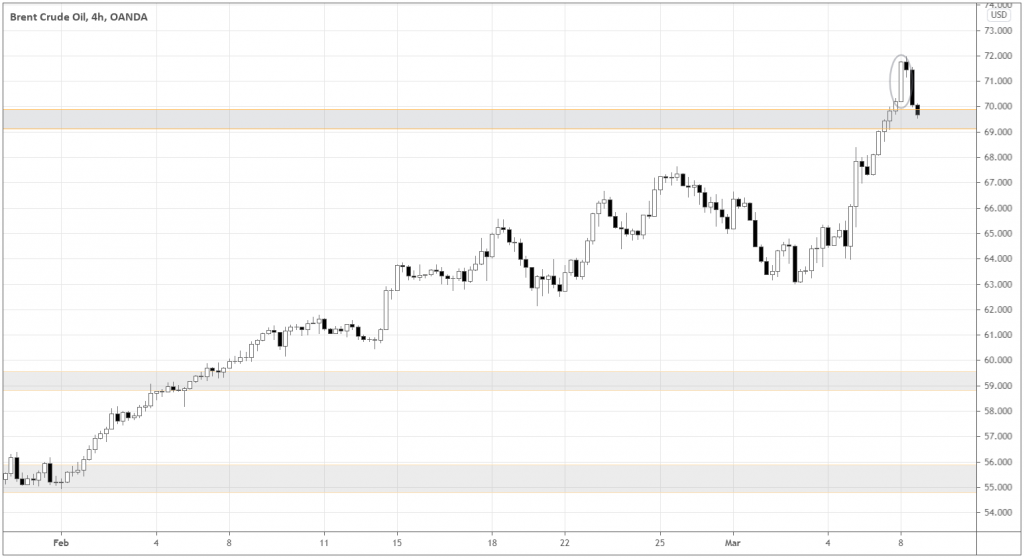
After Brent steadily climbed above the 69.0-70.0 key resistance area, the attack caused traders to frantically buy the instrument, probably expecting that the attack’s implications could be severe, causing the disruption of oil supply in the future.
Whether due to outcomes being less severe than expected or because of the momentum accumulated since long ago, supply at this price level, the price sharply tanked back below 70.0.
If the sellers could absorb all of the rushing believers in the oil supply disruption, a short-term surge in oil prices could be in trouble as swift traders that got caught on the wrong side of the market would consider covering their longs to avoid further losses.
The price action made a long upper shadow of the daily candle.
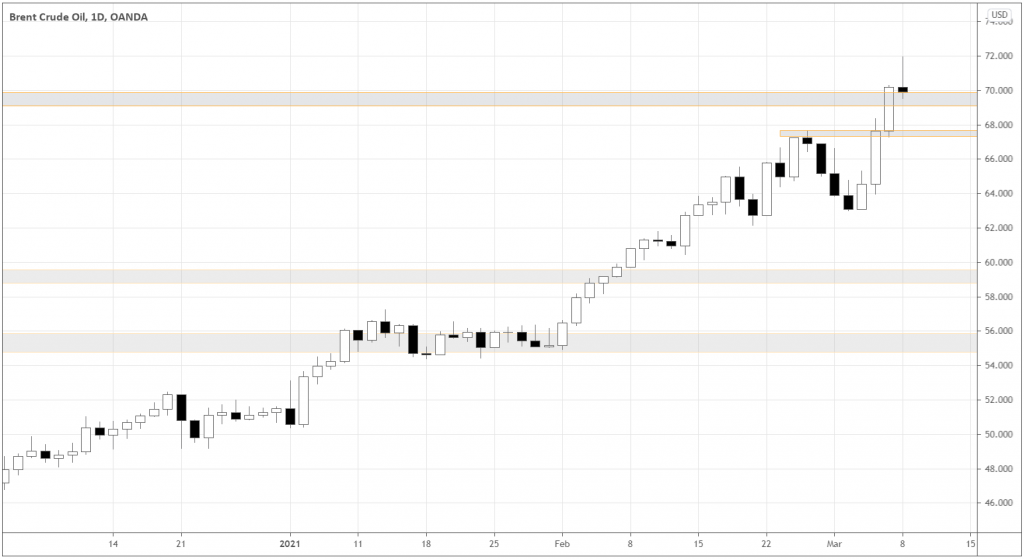
If today’s session closes near lows, we will get a shooting star candle, which is a bearish signal, especially when formed near a key price level.
How to trade the oil outlook with USD/CAD?
Similarly to Brent, CAD has appreciated since it bottomed in March 2020 as Canada is one of the biggest oil producers. The weekly chart below shows the downtrend in USD/CAD that has respected the trendline as the market tested it three times.
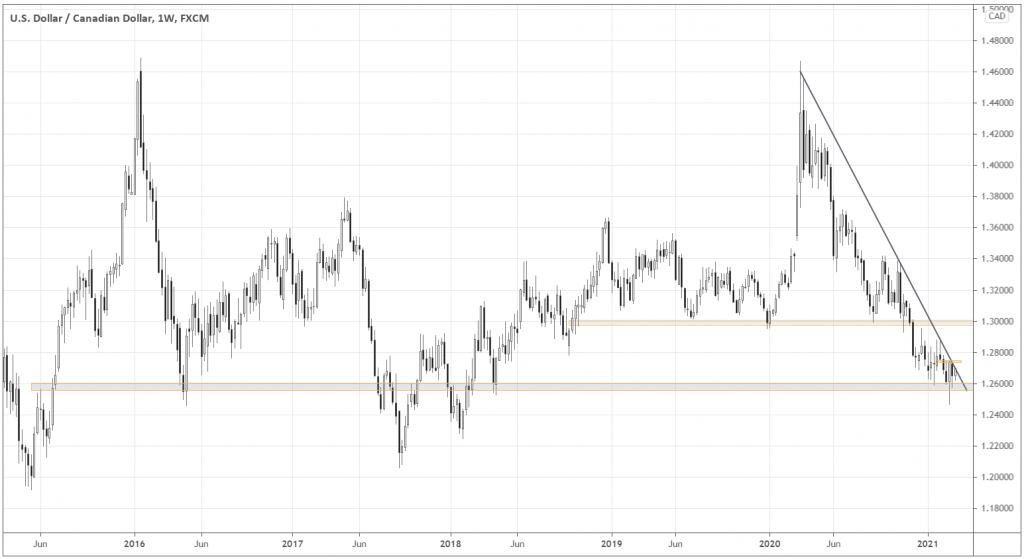
On the way down, the pair broke down 1.3 support level, which was likely to become new resistance. The market pierced the 1.26 support level and held above it. In the daily chart below, the market has been consolidating between the long-term support of 1.2600 and the local resistance of 1.2750.
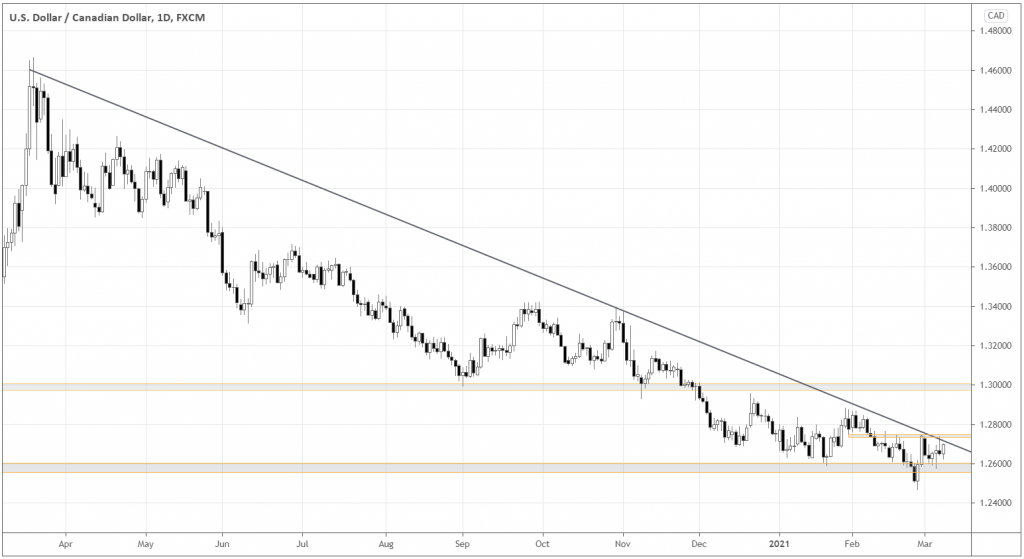
The breakout of 1.2750 can trigger the correction (which is very likely as oil hasn’t experienced any significant correction since November 2020) to 1.3 and even subsequent change of the overall downtrend. Traders may buy if a daily candle closes reliably above 1.2750, keeping protective stops below the candle’s low.
Summing up
Oil has reached a critical price level and may experience a correction. The recent incident with the Saudi oil terminal attack may trigger a turning point in the oil trend. USD/CAD provides trading opportunities to take advantage of the evolving trend in oil.


Leave a Reply