In forex trading, there are numerous indicators that are used, each with its set of advantages and disadvantages. Many of the most popularly used indicators, such as Bollinger Bands, stochastic, RSI and MACD, have been used individually by many traders. In a perfect market, traders can just rely on any one of these indicators and trade strictly by what the indicator tells them. However, market conditions are not always perfect and ideal.
Thus, indicators are used together in some situations so that each indicator can screen the other one. For instance, a trader might have three indicators and would not start trading unless all three of them give the same signal.
To better understand how indicators can work together, we need to first take a look at the individual indicators in question, namely, Bollinger Bands, Stochastic, RSI, and MACD.
Bollinger Bands
Bollinger Bands is an indicator that uses two bands to forecast the potential high and low prices for an instrument, relative to a moving average. The bands usually appear to move in a synchronous pattern during normal market conditions. A trader can gauge the volatility in the market, by simply observing the distance between the two bands.
The indicator was developed by John Bollinger, mainly to measure the volatility of a market. The bands contract when the market is quiet and expand when the market is loud.
Stochastic
The stochastic oscillator is a momentum indicator. This indicator compares a particular closing price of a security to a range of the security’s price over a certain period of time. One can reduce the sensitivity of the oscillator to market movements by adjusting the time period by taking a moving average of the result. It is used to generate both oversold as well as overbought trading signals, generally represented within a range of 0 to 100.
The stochastic oscillator consists of two lines. The “%K” represents the indicator itself, and the signal line is indicated by %D. The signal line reflects the three-day simple moving average of %K.
RSI or Relative Strength Index
The RSI or Relative Strength Index is one of the most commonly used indicators, used for indicating temporary overbought and oversold conditions in any market. A market is said to be oversold when the RSI readings are under 30 and overbought when the RSI value is above 70. Some traders and analysts tend to change these numbers to 20 and 80 instead of 30 and 70. It is used by many traders as part of their intraday forex trading strategy, which can be designed in a way to take advantage of the indications of the RSI. When the RSI signals that the market is overextended, it is likely that the market will retrace.
One of the weaknesses of the RSI is that is it prone to spiking up repeatedly up or down, caused by sharp price movements, which in turn produces false signals.
MACD or Moving Average Convergence Divergence
MACD or Moving Average Convergence Divergence is a trend-following momentum indicator. It shows the relationship between the moving averages of a security’s price. It is calculated by the 12 periods EMA (exponential moving average) subtracted by the 26 periods EMA.
The MACD is used to identify moving averages, which indicate either a new, bullish or bearish trend. The MACD triggers technical signals if it crosses above or below its signal line. It helps investors understand whether the bearish or bullish movement in the price is either weakening or strengthening.
Using Bollinger Bands and Stochastic together
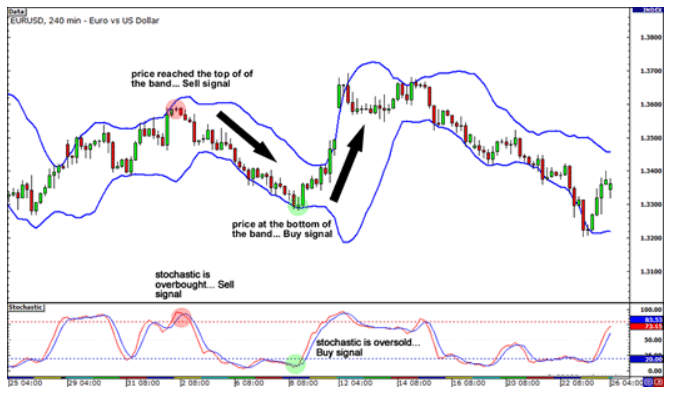
To help explain how this works, we take both indicators on a EUR/USD currency pair’s 4-hour chart. Traders have to watch out for the “Bollinger bounce” since the market is moving sideways or is ranging.
In the chart above, traders have to look out for sell signals from the stochastic as well as Bollinger bands. Here, the EUR/USD pair has climbed up on the top of the band, which acts as a resistance level. The stochastic on the other hand has reached the overbought area, which suggests that the price can drop down in the near future.
If we further take a look at the chart, we can see that the EUR/USD pair, fell by around 300 pips. A trader would’ve made a substantial profit if he/she took the short trade. This indicates that the EUR/USD pair could bounce up from there. Additionally, since the stochastic is in the oversold area, it indicates that the trader should go long. Traders taking that trade would’ve gotten around 400 pips in profit.
Using Relative Strength Index and Moving Average Convergence Divergence
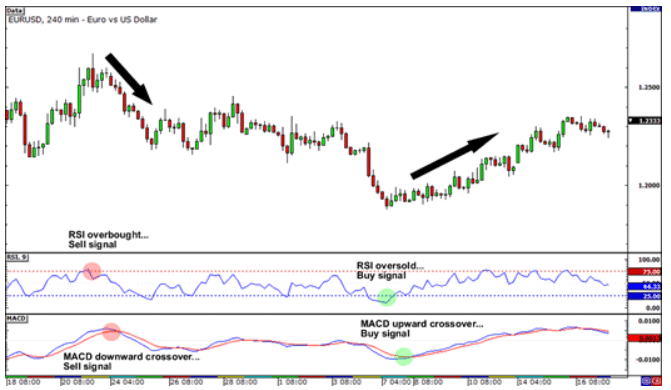
In the chart above, we can see that the RSI has reached the overbought area, producing a sell signal. The MACD soon follows with a downward crossover, also indicating a sell signal. As we further examine, we see that the price did, in fact, move downhill from that point.
Eventually, the RSI dips to the oversold region, producing a buy signal. The MACD follows suit after a few hours, also producing a buy signal.
One thing to be noted here is that the RSI gives signals earlier than the MACD. This is because of the various properties and formulas associated with each of these technical indicators, which allows some indicator to produce signals ahead of others.
Conclusion
When trading with indicators, there is no fixed rule of using a particular set of indicators together for achieving success. It ultimately depends on the individual trader, his/her preference and trading style. In the above instances, Bollinger, MACD, stochastic and RSI can be used in combination to screen each other’s signal.
It should be pointed out that there isn’t a perfectly successful combination of indicators that would produce the right signals in all instances. Traders should thus study the concepts and usage of each of these indicators on their own, to realize how these behave, relative to price movements. They can then easily come up with a combination of indicators of their own, that perfectly fits with their trading style.


Leave a Reply