
Anyone trading on the forex market is aware of the importance of different chart patterns used during forex trading. Forex chart patterns can be best described as an on-chart price action patterns, which have a higher than average probability of following through in one fixed direction. These chart patterns form the basis of technical analysis conducted by numerous traders around the world for executing profitable trades.
Forex chart patterns tend to offer significant clues when it comes to price action trader. Traders tend to identify chart patterns and take advantage of any upcoming price swing.
Even though there are numerous forex chart patterns used in everyday forex trading, chart patterns can be categorised into three main groups, namely Continuation Chart Patterns, Reversal Chart Patterns, and Bilateral Chart Patterns.
We shall now discuss each in brief, one by one.
Continuation Chart Patterns
A Continuation Chart Pattern normally appears when the price is trending. The price is said to be “correcting” if a continuation chart pattern is spotted during a trend. Thus, it indicates that the likelihood of a new move happening in the same direction is great. These patterns are also called consolidation patterns as they present a clear picture of how buyers and sellers take a break before moving further in the same direction of the previous trend. Some examples of continuation chart patterns are given below:
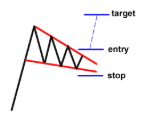
1. Falling Wedge
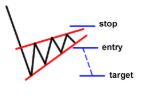
2. Rising Wedge
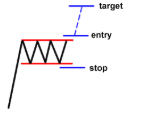
3. Bullish Rectangle
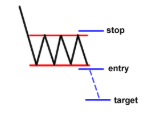
4. Bearish Rectangle
5. Bullish Pennant
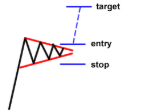
6. Bearish Pennant
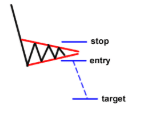
Trading these patterns is simple when compared to other charts. The trader simply has to place an order above or below the formation which follows the direction of the ongoing trend. They should go for a target which matches the size if the wedges and the rectangles chart pattern. When using Pennant graphs traders can aim higher, targeting the height of the mast of the pennant.
When using continuation patterns, traders are advised to place stops just above or below the actual chart formation. For instance, traders should place their stops a few pips above the top or resistance of the rectangle charts.
Reverse Chart Patterns
Reverse Chart Patterns are trend reversal chart patterns which usually appear at the end of a trend in the market. In most cases, when a reversal chart formation is seen when the price is trending, it indicates that the price move will reverse in the future, with the confirmation of the formation. Thus, reversal chart patterns can signal that the current trend is ending and a contrary move is on the way.
When using reversal chart patterns, it is important to know that if it forms during an uptrend, it indicates that the trend will reverse with the price heading down soon. Similarly, if it’s formed during a downtrend, the opposite is true, i.e., it indicates that the price will move up later. Some examples of reversal chart patterns are mentioned below.
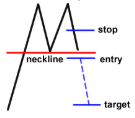
1. Double Top
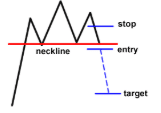
2. Head and Shoulders
3. Rising Wedge
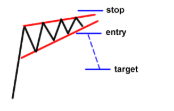
4. Double Bottom
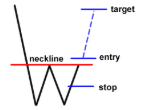
5. Inverse Head and Shoulders
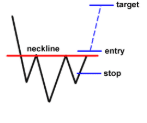
6. Falling Wedge
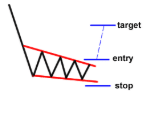
When using Reversal Chart Patterns, traders have to place an order beyond the neckline, in the direction of the new trend. The target set should be almost at the same height as of the formation. For Example, Traders place a long order at the top of the formation’s neckline, when they see a double bottom. They should go for a target which is as high as the distance between the bottoms and the neckline in the graph.
Traders are advised to place stops for proper risk management, which can be set around the middle of the chart formation. This can be calculated as the distance of the double tops from the neckline, divided by two, using that figure as the size of the stop.
Bilateral Chart Patterns
Bilateral Chart Patterns signal that the price can move in either direction. It includes the majority of triangle formations when it comes to charts. Price can normally break either to the down side or the top side, in the case of triangle formations. Some examples of Bilateral Chart Patterns are mentioned below.
1. Symmetrical Triangle
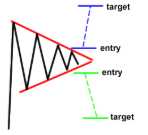
2. Ascending Triangle
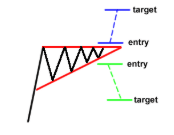
3. Descending Triangle
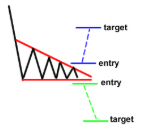
When using Bilateral Chart patterns, both upside and downside breakouts need to be considered. Two orders should be placed, one at the top of the formation, and the other at the bottom. If anyone order gets triggered, the trader can cancel the other one. This doubles the possibility of finding trading opportunities.
It should be known that traders could catch a false break of the entry orders are set too close to the top or the bottom of the formation.
Neutral Chart Patterns
Neutral Chart Patterns are chart formations that can likely push the price towards a new move. The direction, however, remains unknown. These patterns may appear during non-trending as well as trending periods. Spotting a neutral chart pattern is helpful as the trader can open a position in the direction of the breakout, once it is formed.
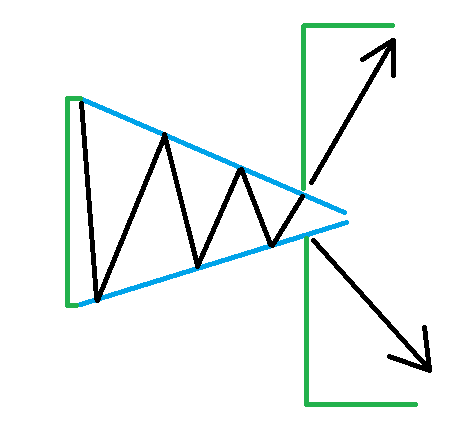
A Symmetrical Triangle chart is an example of a neutral chart pattern. It consists of two triangles with approximately the same sized sides. When a symmetrical triangle occurs the price is expected to move in an amount equal to the size of the formation. Since the direction of the breakout remains unknown, traders who use price action tend to wait for the breakout to occur, to confirm the potential trade direction of the formation.
Traders are advised to place a stop loss right beyond the opposite end of the breakout side, when trading a symmetrical triangle.
Conclusion
Forex chart patterns are regarded as one of the most effective tools a trader has got at his/her disposal. They form the basis of underlying buying and selling pressure. Most chart patterns have a proven track record, as traders use them to identify either continuation or reversal signals, as well as identifying price targets and open positions. There are several types of chart patterns used by traders around the world, of varying complexity. The above list only covers just a few of these.


Leave a Reply