‘Change is the only constant’ is an adage that fits when talking about Forex. This is because it is a dynamic marketplace that requires traders to come up with constant improvisations in the methods they employ.
Volume is one such component in Forex that can be leveraged to capitalize on the big price moves and attract huge profits. Read on to know about volume usage and the crucial indicators that are based on volume measurement.
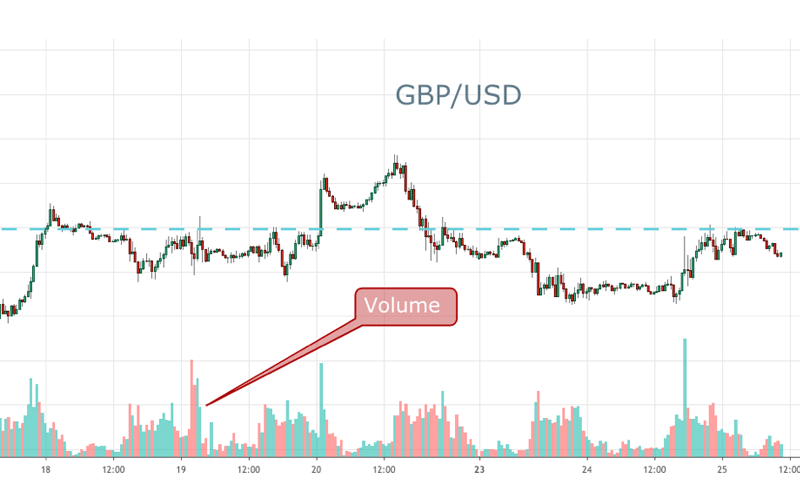
How to use volume
The measure of financial assets that are traded during a specific span is called volume. By relating this measure to rates, it is easy to assess the market sentiment. This is why traders find it a useful armament.
With Forex trading occurring in a market that is decentralized, it is difficult to assess the precise value of money traded at any given time. The data, if present, varies based on the broker platforms used.
However, when you use appropriate tools, volume enhances your strategy effectively. Before you start using the trading tool, here is a list of guidelines or rules to know for analyzing this component. Find the main rules below.
Rule #1: Volume-price reversals relationship
A reversal of rate is established when there is high volume, minimal movement of rates, and ranging of the rate subsequent to an extreme and long movement of the price. A directional change occurs next to the approval.
Rule #2: Spot the bullish signs
Recognizing a bullish signal is easy with volume. Consider the case of a surge in volume during a rate decline followed by higher and again a lower move. If the falling rate does not go below the preceding low level and the volume reduces on the second fall in rates, it denotes a bullish movement.
Rule #3: Trend strength and weakness validation
A high volume is indicative of a thriving market. When the numbers look good, the market sentiment is high, resulting in escalating rates.
In contrast, low volume and the surging price are indicative of dismal interest and signal a probable reversal. So, low volume with price surge or drop is a weak signal. And, high volume with a surge or drop in price is indicative of a stronger signal.
Rule #4: Breakout confirmation
A surge in volume when there is a range breakout or similar chart formation is denotative of a stronger move. On the other hand, a reducing or unchanged volume during breakout suggests receding interest and a possibility of the breakout being fake.
4 useful volume indicators
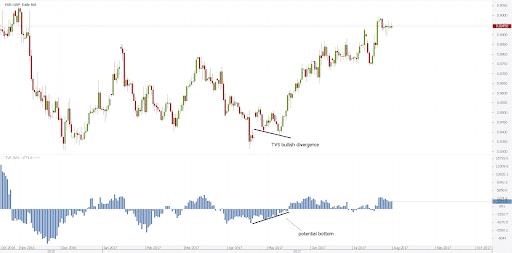
The indicators based on volume are generally based on mathematical calculations and depicted in major charting formats. Although they are not necessary when used, they are good decision-making tools.
Some popular, handy, and effective indicators are listed here. These are nothing but mathematical parameters depicted in visual chart format.
Volume-weighted average price (VWAP)
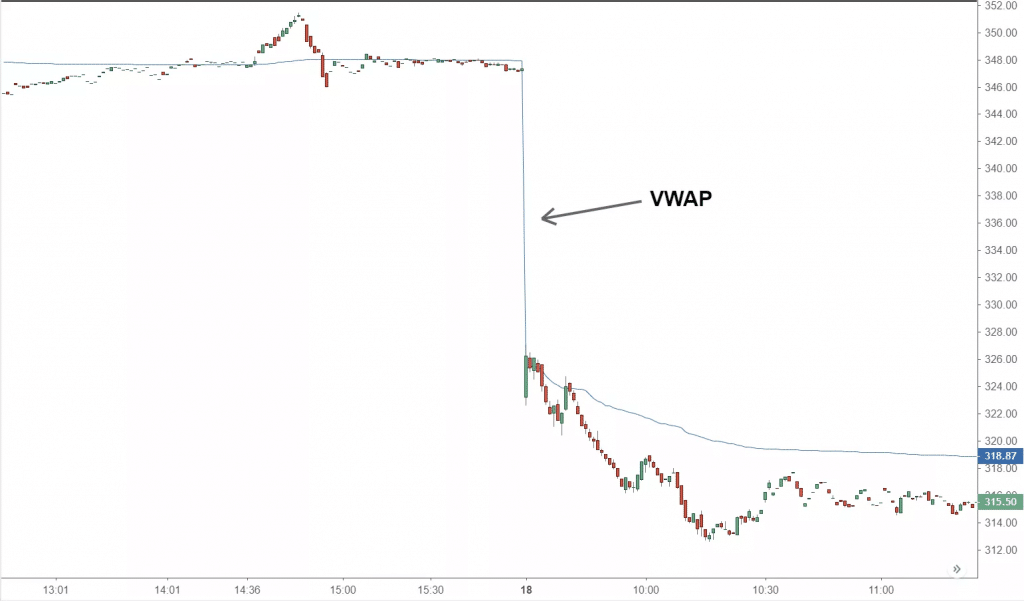
This is a trading standard that provides average daily rates of a traded security. The values are formed from the rate as well as the volume. The VWAP is crucial as it elicits good insights into the prevailing trend and a security’s value. Thus, this is an immensely useful tool for deciding the intraday changes.
Mostly large institutions find this tool significant as it aids in moving stocks into or out of the market. Generally, selling is done above the VWAP and purchasing below it. These moves keep the rates at average levels.
Chaikin Money Flow
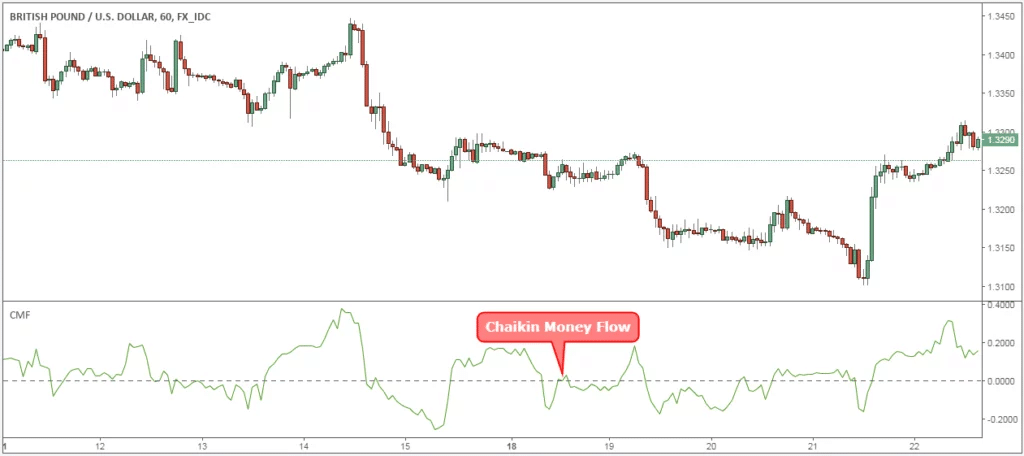
CMF indicator uses institutional distribution and accumulation as its basic strategy. Marc Chaikin created this format, which is popular for its oscillations and employs it to identify divergence.
The basis of CMF is that surging rates should have an equally surging volume. So, CMF provides a corresponding strength value when rates end up at high or low in connection to the daily range. Thus, CMF targets increasing volume. Negative values result when the closing rates are found on the bottom part of the price range, and higher values form when there is surging volume, and the rates are at the top part of the daily range.
On-balance volume (OBV)
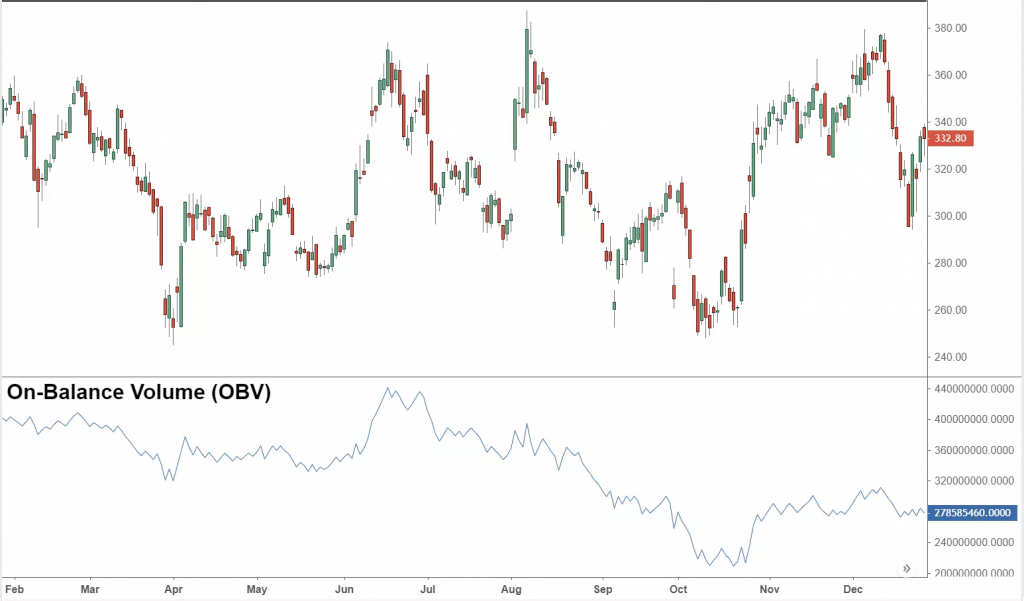
For knowing the accumulating stocks and current sum, the OBV is very convenient. This Joseph Granville tool is also indicative of the divergences, including a surge in rates with a slower pace of volume surge or even a slight reduction.
In this tool, the volume is included during a higher market finish, and when the ending value is low, the volume gets deducted. The signal provided by the OBV can be used for trade entries.
Klinger oscillator

Created by Stephen Klinger, this tool helps predict trends over the long-term and assess them. Simultaneously, this instrument also remains conscious of the changes happening over the short-term. The mode of action is a comparison of the volume with rate moves to generate the oscillator outcome.
The changes that occur around the zero-level help in the formation of other signals. MAs, trendlines, etc. are used alongside this oscillator for validating signals. Furthermore, triangles and other similar formations are put to use for validation. Since divergences and crossovers are frequent occurrences, it is sensible to use this indicator in concurrence with other trading tools.
Key points
One of the significant tools employed in studying market trends, the volume has multiple functions in Forex. It is valuable in evaluating how strong or weak the market is. Many people use it to verify if the volume validates the rate movement or indicated reversal is nearby.
Thus, it is considered to play a crucial role in decision making. Despite the tool not being accurate, it aids in spotting the exit and entry signs by correlating three factors, namely the indicator, volume level, and rate movement.
Hence, it is a potent method that is exploited by traders and has given fruitful outcomes. When used appropriately, these tools can aid in making your efforts successful.


Leave a Reply