In the 1970s, Gerard Appel, the illustrious founder of the New York-based asset management company Signalert, invented MACD. Even today, technical analysts swear by this indicator to study trends in trading.
In trading, predicting trends is the most important thing, as it helps you to make a substantial amount of money. Learn how to use this tool for identifying Forex Trends.
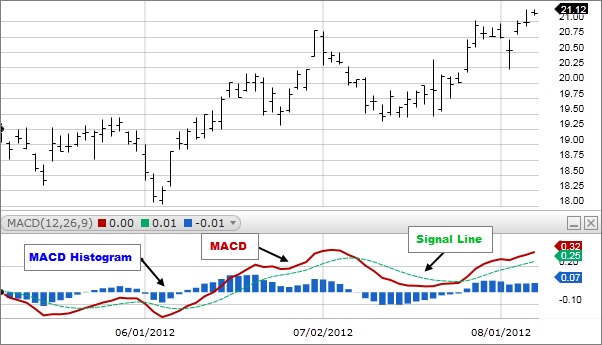
What is the MACD an indicator?
MACD is the short form of moving average convergence divergence, an indicator that follows and captures trends. This tool can help you recognize how a pair of moving averages are related to each other. To be more precise, it helps you find out the gap between the security’s respective EMAs for 26 and 12 days.
The line depicting MACD fluctuates back and forth somewhere near the zero line. The increasing gap between the indicator and the standard line signifies an expansion in the gap.
How the MACD indicator works
Let us now take a look at how this indicator actually works.
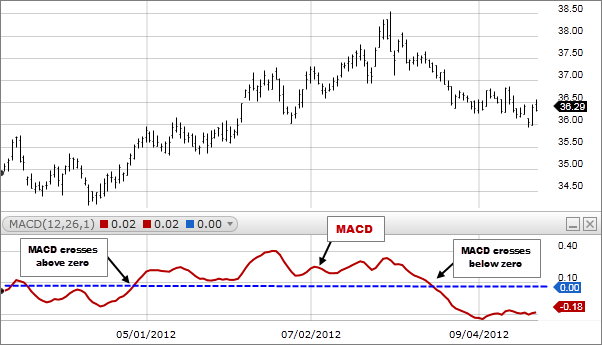
- Firstly, when it surpasses the zero line, it is said to be bullish, while moving beneath zero signifies a bearish MACD. The diagram below clearly shows this phenomenon.
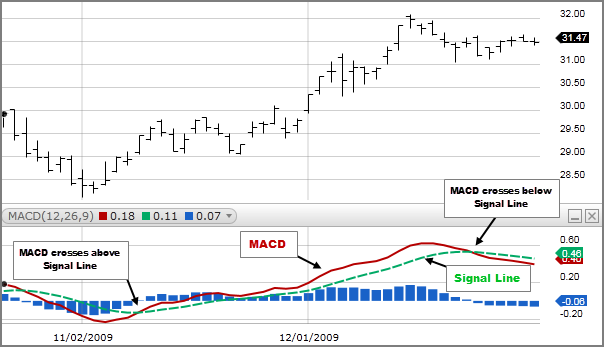
- MACD turns bullish as it intersects the signal line and goes further up. The strength of the signal increases as it shifts beneath the line representing zero.
- MACD turns bearish as it cuts across the signal line, moving further lower. In this case, the signal strength increases with the distance above the line that represents zero.
- While you are range trading, the MACD indicator shows a saccadic movement over the signal line. People who use this indicator do not usually trade during this time in order to decrease the portfolio’s fickleness.
- As the bifurcation between the price action and MACD validates the crossover signals, it becomes stronger.
How to trade using MACD
MACD is a moving averages based tool, and it is inherently lagging because moving averages assemble beyond price data as per the settings requirements. Sometimes by only looking at the price, you cannot track the fluctuations in momentum and trend. In this scenario, MACD is an ideal tool to use.
Here are some of the most vital patterns that can be of assistance while you’re trading with the help of MACD.
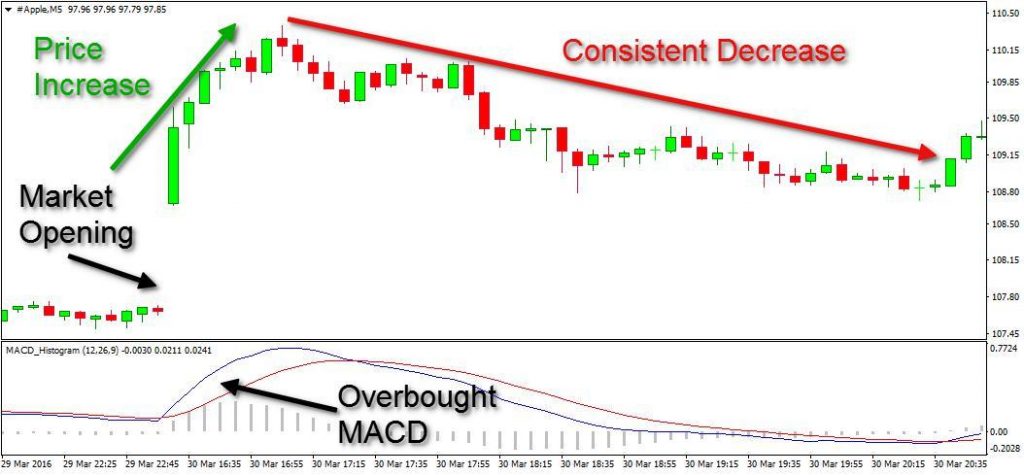
Overbought/oversold levels
MACD graphically depicts the association between the EMAs for 26 and 12 days, thus plotting a signal line above it. Using this, you can easily point out occasions for purchasing and selling. A level is said to be oversold when the indicator intersects the line and moves further upwards, motivating traders to make purchases.
In contrast, when the indicator intersects the signal line and moves further downwards, it indicates that the level is overbought. The trader often takes this as a sign to sell. Since it is devoid of a fixed graphic range, the MACD oscillator is unable to provide the exact readings for oversold and overbought conditions.
Signal line crossovers
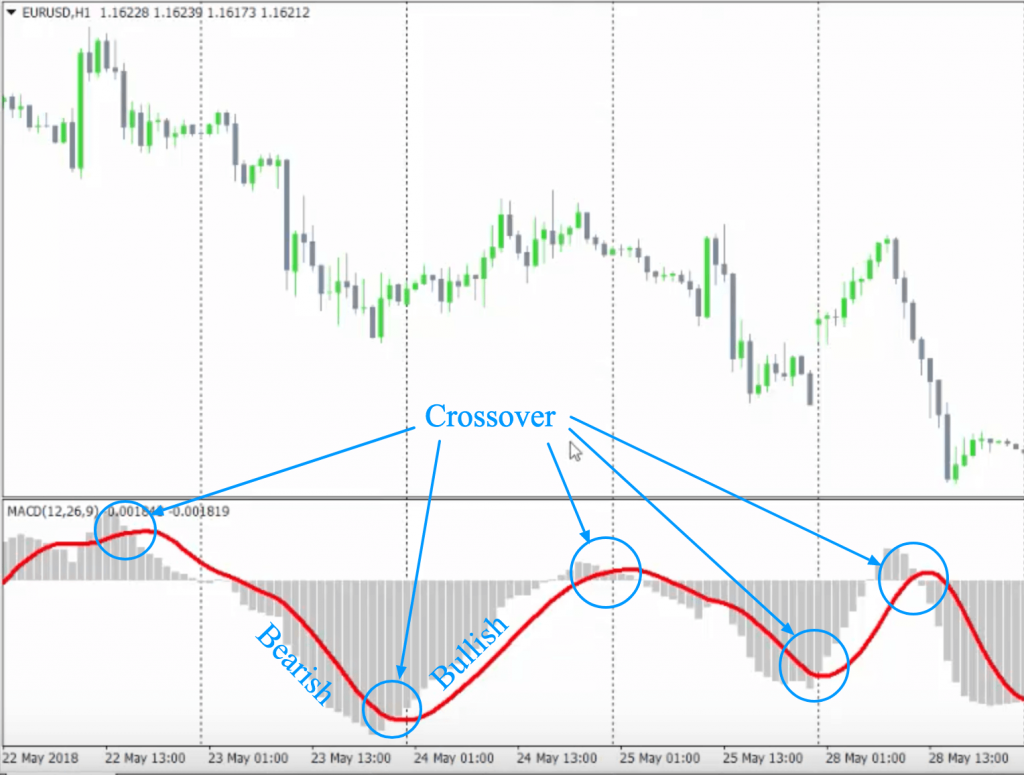
This describes an occasion when the line is representing MACD cuts across the signal line. As a general rule, when the indicator moves downwards, it is an indication to sell since it signifies a bearish trend. When it cuts across the line and moves further upwards, buyers are the ones who are more favored by the trend, which is bullish in nature.
One can track this quite easily with the help of a MACD histogram. But as is the case with other tools used for following and confirming trends, it does give rise to the sporadic false signal. Thus, before entering a trading position, it is wise to make sure the crossover has actually taken place.
You might be wondering how you can confirm the same. You can do this by being patient and letting the trend advance in a similar direction. Additionally, you can take the help of other indicators to see if a similar kind of pattern appears.
Divergences
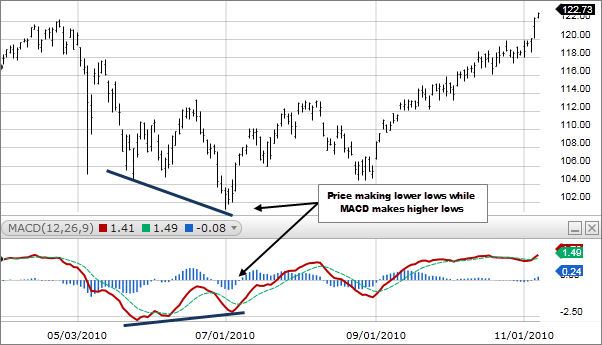
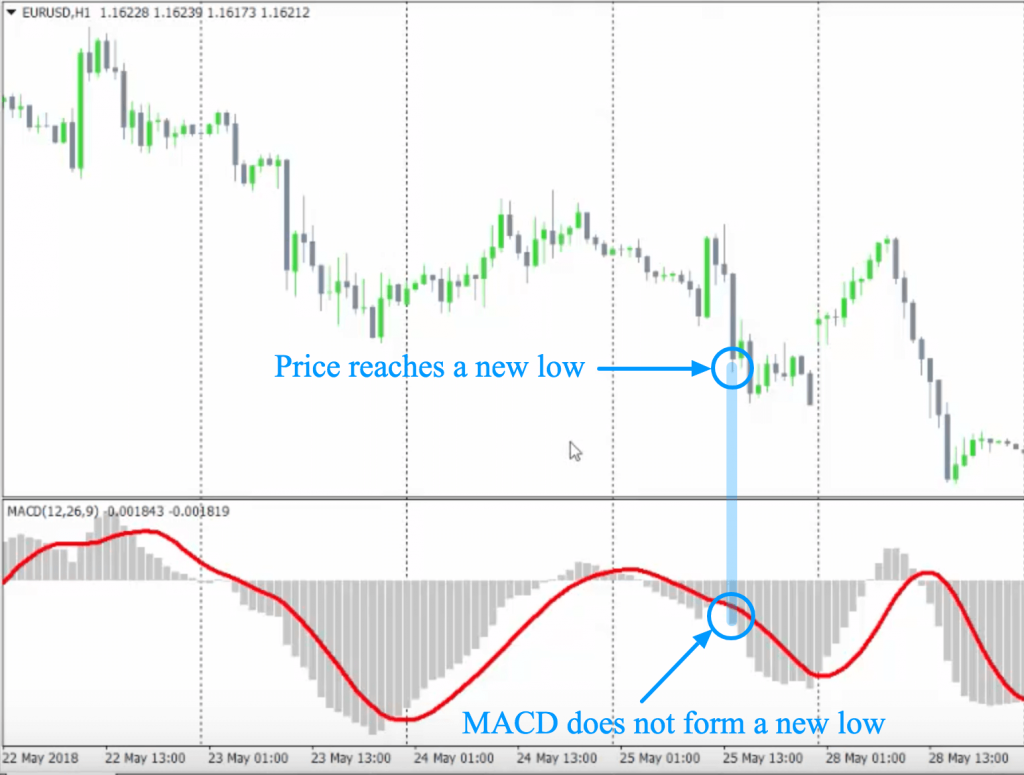
This is a popular trading technique for which many traders prefer MACD. Usually, traders try to locate the chart points where the price either reaches a new high before swinging downwards or a new long before an upwards swing. However, the bar graph representing MACD that, in turn, illustrates momentum does not display this extreme.
The bifurcation between momentum and price tells a trader that a market reversal is underway. Let’s say a stock market trader is looking at the below divergence live while having zero ideas about what will happen in the future. In this case, they will most probably initiate a long trade after predicting the price reversal.
Zero line crossovers
As soon as the indicator line shifts to and fro from the line depicting zero, a crossover is said to have taken place. In case the former happens, the signal is said to be bullish, and otherwise, it’s bearish.
This phenomenon sometimes signals a trend moving in another direction. But as a rule, most people trust a signal line crossover to a greater degree due to the fact that this pattern does not clearly indicate at what rate the trend is shifting.
Pros and cons
To sum up, let us look at how MACD can be advantageous or disadvantageous.
Pros
- It can be interpreted in several ways and used to conduct effective trades.
- The different patterns related to MACD provide you with lucid signals for selling and buying.
- If you wish to achieve a greater degree of coherence, you can use it alongside other indicators.
Cons
- If your outlook exceeds 26 days, MACD will not prove to be of much use to you since that is the limit of its measurement.
- It is not ideal for recognizing a future trend.
The bottom line
MACD can be used in a systematic way to assess the direction of a trend or to calculate the momentum. It is preferred by traders who don’t like to deal with jumbled charts. However, it is vital to take the help of other tools, as it sometimes spawns false signals that might cause you to take a rash trading decision.


Leave a Reply