
The bullish patterns are formations on a price chart that are often formed during a downtrend and are usually taken as a sign of an impending reversal towards the upward trajectory. However, investors should be patient until such a time that the upward price movement is confirmed before going long.
Types of Bullish Candlesticks
Five main types of candlesticks communicate a bullish charge, as we discuss below.
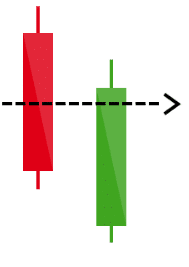
Bullish engulfing
In this pattern, there must be 2 candlesticks that have to be aligned in a particular way. The black or red candlestick is supposed to be shorter and smaller than the green or white candlestick. The two have to be aligned side by side, with the red/black one on the left and the green/white one on the right. This signifies a market being taken over by the bulls. The resultant effect is a rise in the price of the stock/security.
The larger the bullish candlestick, the more reliable and the longer the established pattern will be sustained. Conversely, a smaller bearish candlestick signifies a dissipating bear run.
Apart from price rise, it is also important to look at the volume of trade in the subsequent moments following the formation of a bullish engulfing pattern. An increase in the volume of trade is a sure confirmation of a market reversal because it means that the bulls are willing to pay more even when the supply levels have risen. Looked at from the perspective of day trading, a bullish engulfing signals a stronger action by the bulls than the piercing pattern. This is because it indicates that the previous day’s losses have been covered and new profits are being made.
Inverse hammer
The inverted or inverse hammer is another strong signal of a looming bullish swing by the market. This formation has a characteristic long shadow/wick, which is roughly about twice the length of the main body. It is usually formed as a result of the buyers putting up a strong show and sustaining a price rally that can overcome the pressure from the sellers. This pattern should therefore signal you that it’s time to buy. However, you should confirm the breakout by looking at the margin of price increases.
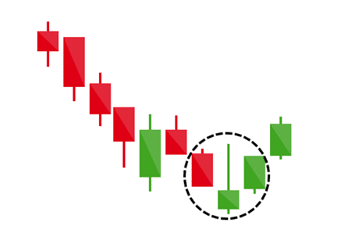
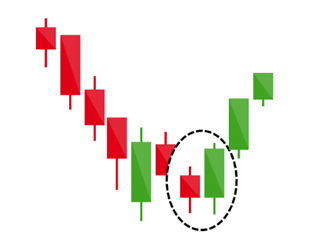
The Morning Star
This pattern also involves three candlesticks, with two bearish candlesticks and one being a bullish one. It is a sign of an impending reversal of price losses in the previous trading session. The pattern has a bearish black candlestick which precedes a smaller white candlestick sandwiched between it and a white candlestick on the right-hand side. It is this positioning of a small candlestick between two larger ones that creates a “gulf.” The big bearish candlestick is formed on the first trading session. Note that the middle candlestick should have a small body and a long wick piercing through it.
When trading, look for the formation of this pattern at or within marginal distance from key support levels. Also, note that the small middle candlestick may at times be bearish and not bullish, but the important thing is that it signals the weakening of the bears and heralds a move towards the uptrend. When this candlestick ushers in the large candlestick on the third trading session, it is the confirmation of the change in trend from bearish to bullish.
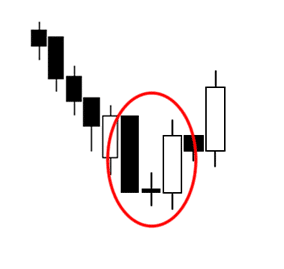
Piercing Pattern
The pattern is another bullish signal formed on a downward trend. During its formation, the underlying factor is that the stock or security will have risen gained so much that it goes some way past the midpoint of the previous trading session. It signals that the bears are unable to sustain their pressure on the buyers and are losing ground. However, the piercing pattern should be confirmed by a spike in prices at the opening of the subsequent trading session.
If the bulls succeed in fending off the bears by buying at higher prices, then the bullish rally will have been confirmed. This will also likely result in higher trading volume on the third day of trading. You may therefore need to reconcile the rise in price with the corresponding change in the volume of the stock/security traded in the market. A higher volume will confirm that the buyers are willing to go all the way and buy and because the significant increase in supply has not absorbed the price pressure.
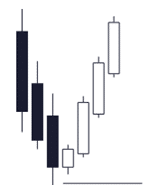
The Three White Soldiers
The three white soldiers are candlesticks formed on the ascending channel and are among the strongest signals of a bullish run. The candlesticks are aligned one after another, with each one standing taller than the preceding one. This means that the bulls have been on the rampage for three consecutive trading sessions, with each new session outperforming the previous one.
While this is taken as a strong control by the bulls, you should be cautious before making further purchases after the third white candlestick. You should keep your eyes on the volume of trade to see if the bulls are growing weary. This is because reduced volumes may mean that the demand is reducing, and thus the prices may start falling. In addition, you should have your ears on alert In case of potential influence from market fundamentals such as unfavorable earnings reports.
Bottom line
Bullish candlesticks are essential in trading because they can help you make the correct calls. While they are easy to spot, there are other indicators and fundamentals that come into play in markets. These must be considered and possibly integrated into decision-making to minimize losses and optimize profits.


Leave a Reply