Hedge funds tend to use powerful indicators based on volume to invest millions of dollars in the markets every day. As retail traders, these will guide us to know what the whales are doing with the money and where they can be buying or selling.
We want to be profitable traders, make a lot of money and live in Miami Beach. But, here is bad news – you can’t move the price while big guys can. Thus it would be a good idea to recognize what market movers are doing.
How do we take advantage of this situation? Simple – studying VWAP and VWMA. So, In this article, we will explain in a simple way how to add these indicators to your repertoire and trade with them to increase your level of success. Let’s get started.
What is VWAP?
VWAP is the average volume of an asset at a certain price and time. It’s represented on the chart below as a blue line.
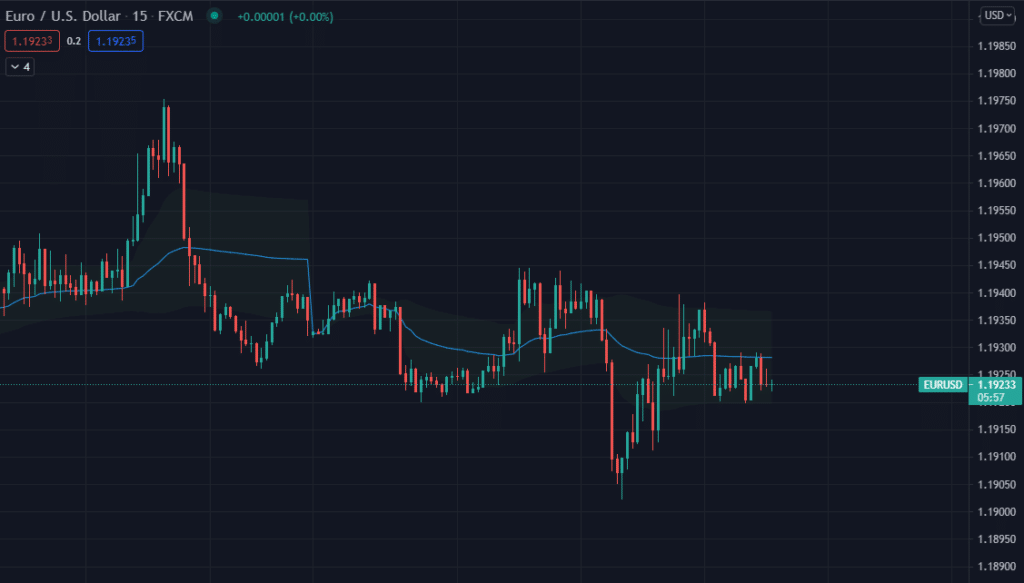
As we have already mentioned, of the volume indicators that exist, many technical analysts consider VWAP one of the most important. It helps to open long and short positions.
How can we use VWAP in Forex?
First, it’s necessary to know the following aspects of this tool:
- It´s reset every 24 hours, at the end of the market session, 21:00 UTC time.
- It´s used as an intraday or scalping indicator.
- It works better in smaller time frames like 5 or 15 minutes.
- It doesn’t need configuration. It’s the same indicator in all time frames.
We should be careful when VWAP resets because the last price level could be a future support or resistance zone.
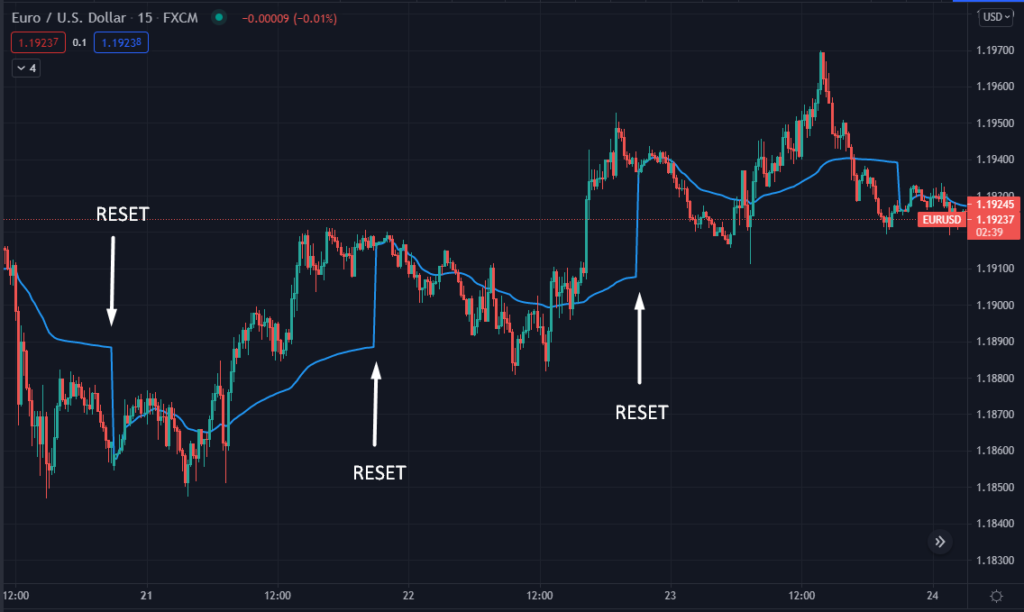
The indicator doesn’t work long-term because of the reset. If you are a swing trader, you shouldn´t be losing time studying this indicator. It’s recommendable to use it in shorter time frames, and if you are using it alone, ensure you close all positions by the end of the session.
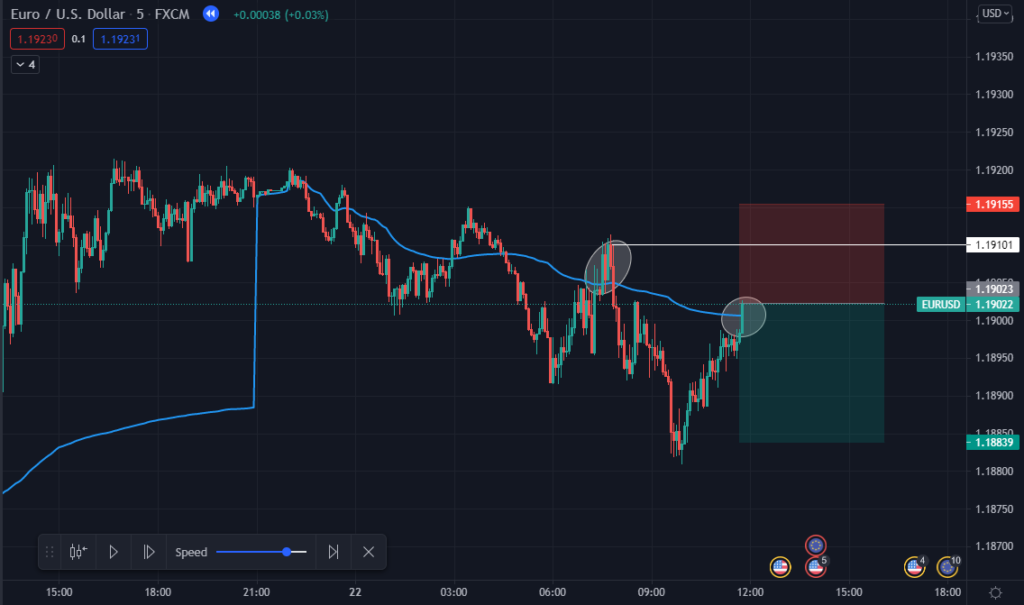
It can work as a Moving Average if we can recognize the trend, being dynamic support or resistance level in retracements. This will give us a good point of entry when the price is near to VWAP.
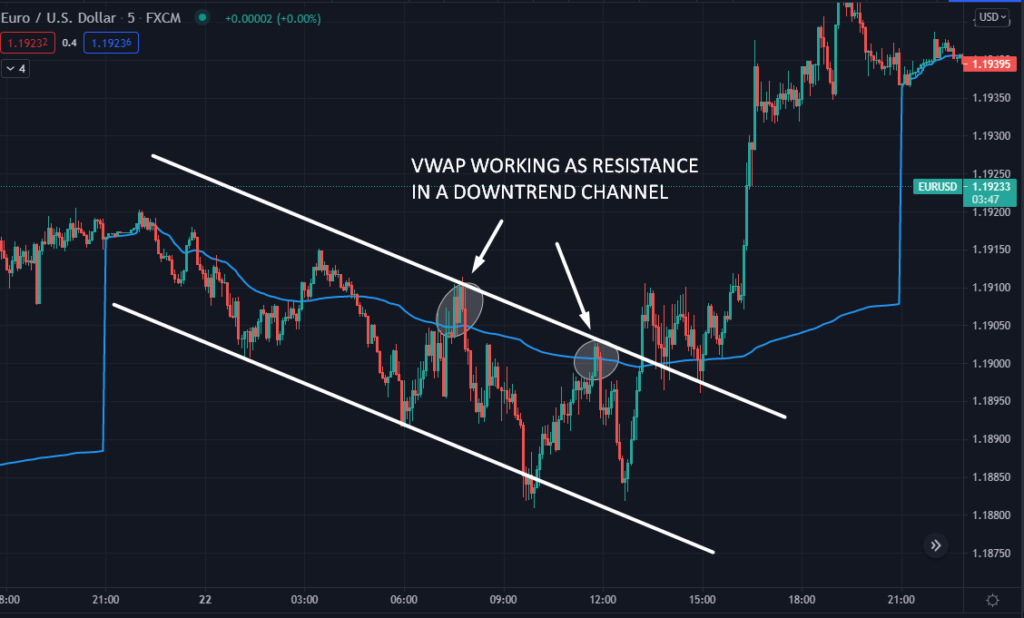
In the screenshot above, you can see how price follows a downtrend, bouncing in areas near the VWAP multiple times, forming new lows until there is a breakout and the trend changes the direction.
If we have identified the downtrend, it’s not a bad decision to open a trade at one of those bounces and place stop loss above the last swing high. Take profit should be placed in the previous swing low. Look at the chart below.
Another way to use it is by executing a reversal trade when the price deviates from the VWAP. If the price moves far away from VWAP, it’s a clear sign of overbought or oversold. Let’s see an example.
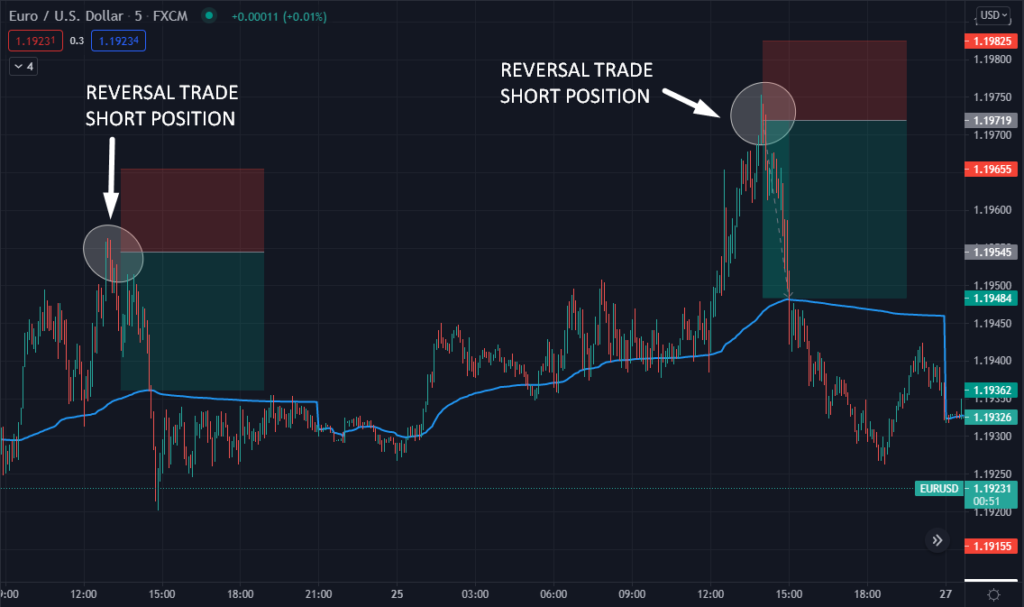
Each time price makes a new maximum, it comes back to the VWAP, working like a magnet. Being aware of it, wait for the price to go away, and anticipate a reversal movement.
What is VWMA, and how to use it in Forex?
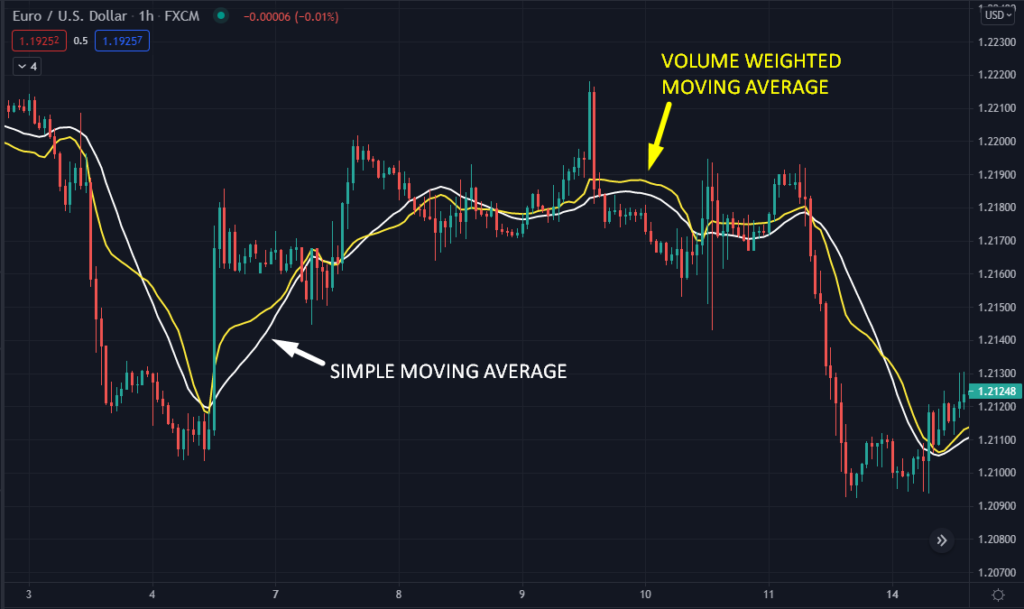
It is similar to a Simple Moving Average except that prices are weighted in a way that most recent price data outweighs the oldest. This reduces the lag seen in Simple Moving Averages (which represent all price data equally).
VWMA reacts quickly to changes because it takes into account the volume. Look at the differences in the chart below when price pumps or dumps. The yellow line moves faster, and the white line reacts later.
Unlike VWAP, it can be used for all types of trading. It does not reset when the new session starts. You must configure the periods according to the time frame you are using.
Here are some uses for this indicator:
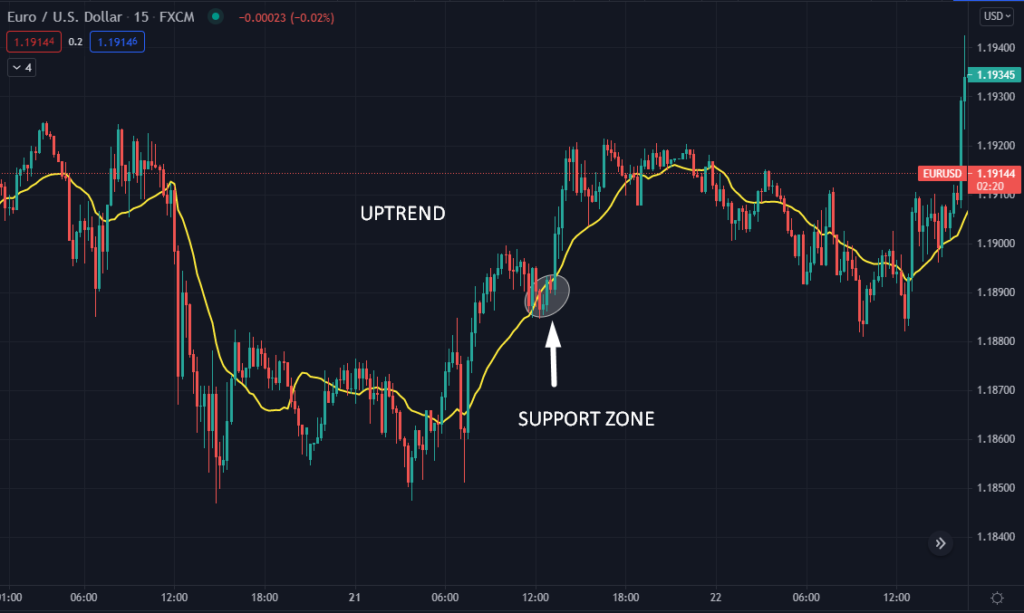
- Helps to determine the trend: when the price is bouncing above the line, it is generally an uptrend sign. On the other hand, when it is below the line, it confirms a downtrend.
- To know support and resistance zones: a rising VWMA indicates support. On the other hand, a drop indicates resistance. Look at the example above.
Conclusion
To conclude, it’s necessary to emphasize that VWAP and VWMA work better with important and liquid assets because they are related to volume and are used by people who constantly want to invest a lot of money in the market.
The asset must have enough movement in the most active hours—for example, the EURUSD or GBPUSD pair.
These indicators do not have a predictive capacity as others, such as the Fibonacci retracement. This is the only notable disadvantage of the tools.
If we want to speculate how far price could go, it would be better to combine them with other types of indicators that predict specific movements.
Also, consider adjusting settings for each currency pair. A 20-period VWMA may perform well in USDJPY but not in USDCAD.
Remember, one of the keys to success is to have enough time and patience backtesting your trading strategy before going all-in with real money. This will determine which type of indicator works best.



Leave a Reply