Time frames communicate the market’s behavior over different durations. Experienced traders appreciate that ultimately, time frames can make a lot of difference and determine whether a strategy becomes successful or not. In the absence of the right time frame, you risk misreading the market, and even the best technical and fundamental analysis tools can fall apart.
Multiple time frame analysis is the technique of examining the same currency pair over a variety of time frames. Typically, a longer time range is applied on a longer-term trend, whilst a shorter time frame is used to identify potential entry points into the market to maximize profits.
The basis for multiple timeframes technical analysis
In order to properly evaluate a market, it is necessary to examine it through at least two time periods. However, compatibility between the length of the position held and the time frame chosen matters a lot.
Using a 1-minute time frame for trading and a monthly chart to look at the trend, for example, would be inappropriate. This highlights the need to use a time period higher than the one in which you are trading to determine the trend. If you are a long-term trader, start with the weekly chart to assess the trend, then employ the daily chart to place your orders.
A short-term trader will use the daily chart to identify trends and the 4-hour time frame to execute trades. The best way to learn and interpret trading signals in our approach is to utilize 4-hour charts to understand the large picture and 1-hour charts to execute trades. The trades that are made in the direction of the 4-hour trend have a greater chance of being profitable.
In most cases, long-term traders will use daily, weekly, and monthly timeframes to trade their positions in the market. As a result, if you are holding a short-term position, such as shorting a forex pair with a transaction time of little more than 30 minutes, you must be certain that there is a firmly established downtrend.
Technical analysis using many timeframes avoids focusing too much on a single timeframe. The long-term timescale is used to predict trends on the forex pair, but a single candle on a 1D chart that provides trading information for a day is useless for determining trade entry points. In this case, short-term timelines should be employed. This might help you determine whether a winning trade in the direction indicated by the long-term charts is possible.
Let’s look at the example below.
Day traders have the privilege of having the entire day to monitor their charts, allowing them to trade with extremely short time frames. These time frames can range from one minute to fifteen minutes to an hour in length and anything in between. Day traders who discover trade setups on the 1H time frame can then employ the 15-MIN time frame to find great market entries.
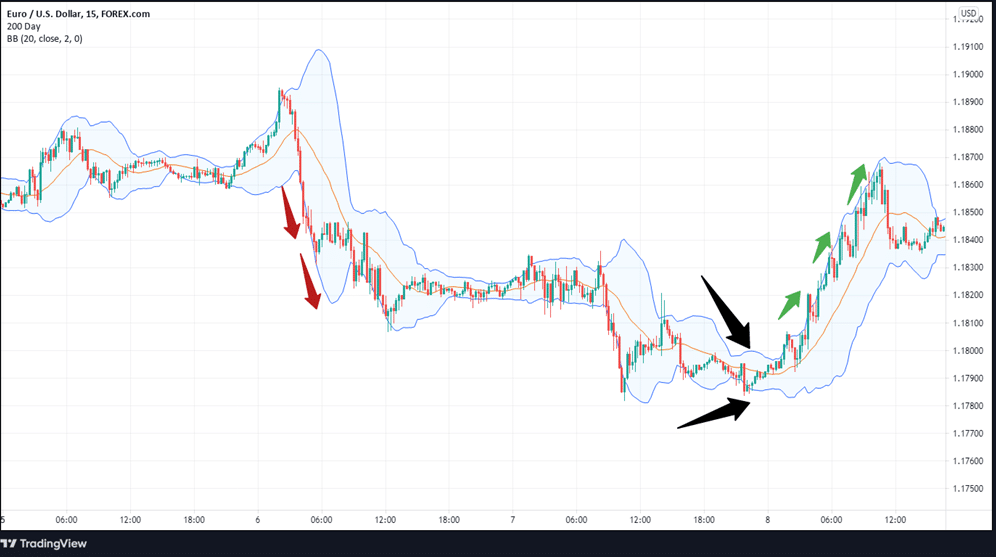
When using the 15-MIN chart, day traders may benefit from an in-depth look at how the price is moving in a shorter time frame. Additionally, the uptrend can be seen on the 15-MIN chart, which further supports the upward bias.

The two black arrows point at the narrow section of the contracting Bollinger Band, signaling impending volatility. Traders can enter a long trade whenever the price breaks through the upper band and utilize either the 20-day Moving Average (MA) or the lower band as a dynamic stop.
Multiple time frames for swing trading
Swing traders spend less time examining charts because they don’t trade frequently. As a result, swing traders will first examine the daily chart to determine the broad trend before zooming into the 4H chart to identify entry points.
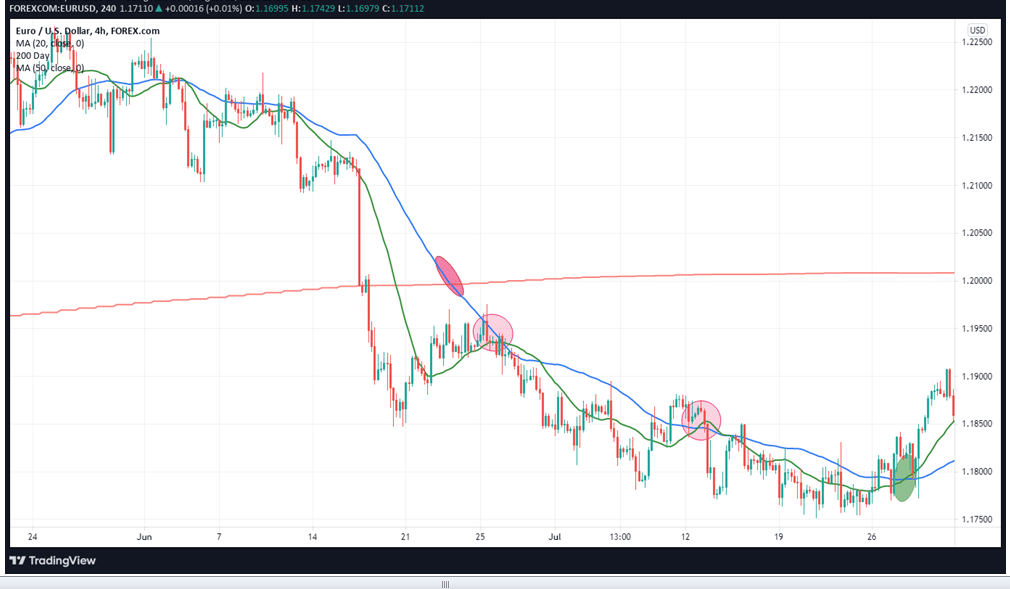
On the EUR/USD, the daily time frame allows traders to notice the downturn, but where is the best place to enter the market? This becomes clearer when we look at the four-hour time span in further detail.
Traders might find short signals by employing the 4H chart. After a steep fall, the price eventually moves back into the trading range after an unsuccessful breakout above the blue MA. A failed move in the upward direction is likely to produce further moves that would favor short trade.

The 200-day Simple Moving Average (red line) is above the current price, and when the price falls back within the range, a crossover occurs as the 20-period Moving Average (green line) crosses below the 50-period Moving Average (blue line). This creates a bearish entry point.
In summary
Always perform multiple time frame analyses by creating both long and short trade scenarios. This promotes broad-mindedness and averts narrow-mindedness. When a trader is primarily focused on short-term deals, they will ignore all potential long-term signals.


Leave a Reply