What is a trend?
It is essential to know what a trend is and its characteristics so that you’ll be able to spot it easily. It also helps to differentiate a trend from other formations to avoid entering a trade you do not understand. There are two main types of trends, namely an uptrend and a downtrend.
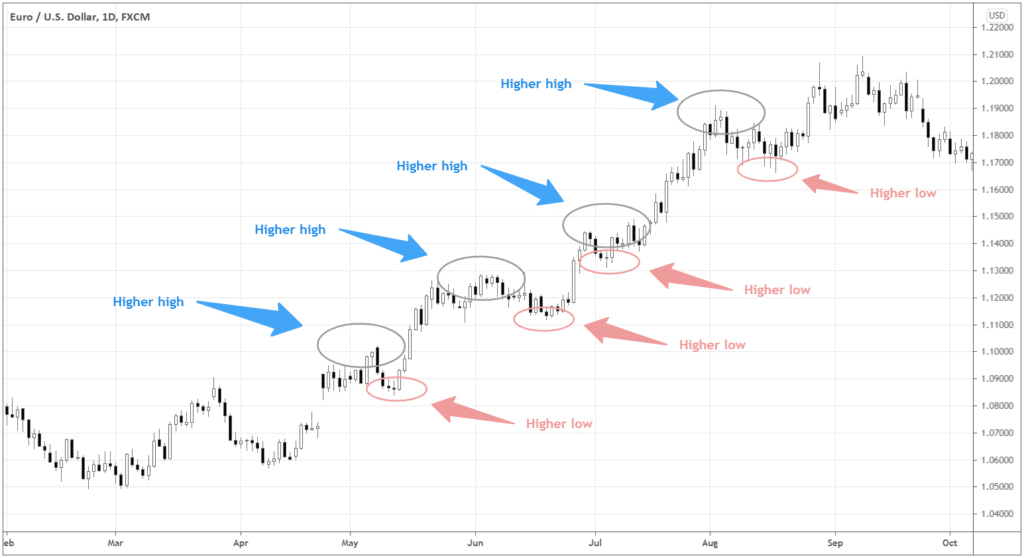
During an uptrend, the highs become progressively higher and the lows progressively higher as well. This results in an upward trajectory that is strong enough to overcome any disruptive corrections. The lower the subsequent lows and highs, the weaker an uptrend becomes, leading to a range and even a downtrend.
Uptrend does not necessarily need to have an interrupted upswing, but it can still be considered an uptrend as long as the intervening corrections are higher than the previous lows. Uptrends provide strong entry signals for traders who want to go long.
Downtrends are formed when the price highs and lows go lower progressively. In this case, corrections must be lower than the previous lows for the downtrend to be sustained.
Otherwise, if the successive lows and highs settle higher than previously, it is a signal that the downtrend is dissipating and likely to reverse.
Downtrends are favored by traders who want to go short. Therefore, they take the cue when new corrections settle below the previous correction’s high.
The prevailing direction of impulses is the trend’s critical factor. The impulses show whether we are having an uptrend or a downtrend. Do not be distracted by corrections or pullbacks. Instead, wait for a breakout to help you spot the likely alignment of the next impulses.

As shown in the chart above, the upswings are sustained despite corrections because the new price swings are consistently higher than the previous ones.
Trend trading strategies
Moving Averages (MA)
Moving Averages help us to consolidate the price action of an asset over different periods, to help us “predict” the likely trajectory of the current price. One of the common ways to use MAs is to combine long-period Moving Averages and short-period ones. The former is slow while the latter is faster.
However, when dealing with MAs, you must remember two critical risks involved. First, the long-period MA is typically slow and may react too late to recent price movement, making you miss an opportunity.
Secondly, the short-period MA may react too fast and send premature, false signals, which may mislead you into making the wrong call.
Moving Averages can be effective when trading the trend.
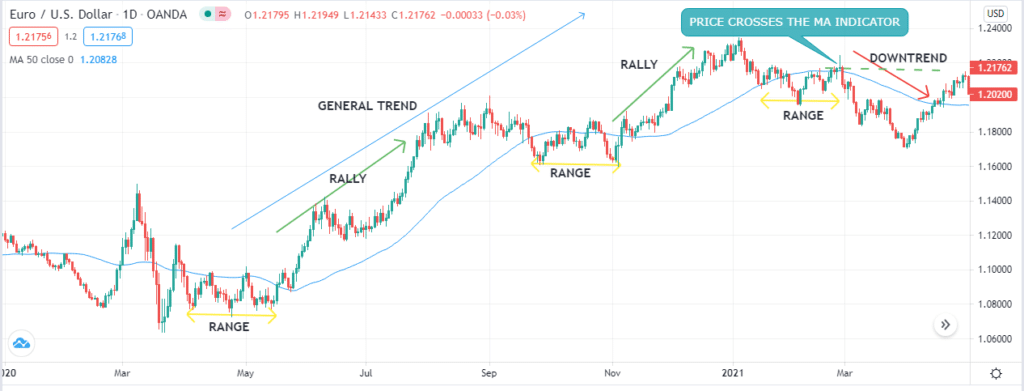
In the chart below, the 50-period MA sent signals depending on its position relative to the current price.
There was an upward rally each time the price moved above the MA. The range came in when the price and the MA were around the same level, while the downtrend was set in motion by the price’s movement below the MA. Therefore, by using the correct time frame for the MA, we can effectively read the trend.

Channels and trend lines
The other way to effectively trade the trend is by using trendlines and channels. The idea here is to define a boundary, beyond which you will know that the trend is about to be broken. With trend lines, you need to have at least two points to help you draw the line. If you can get more, the better, but you should never force a trend line to fit into a non-existent point.
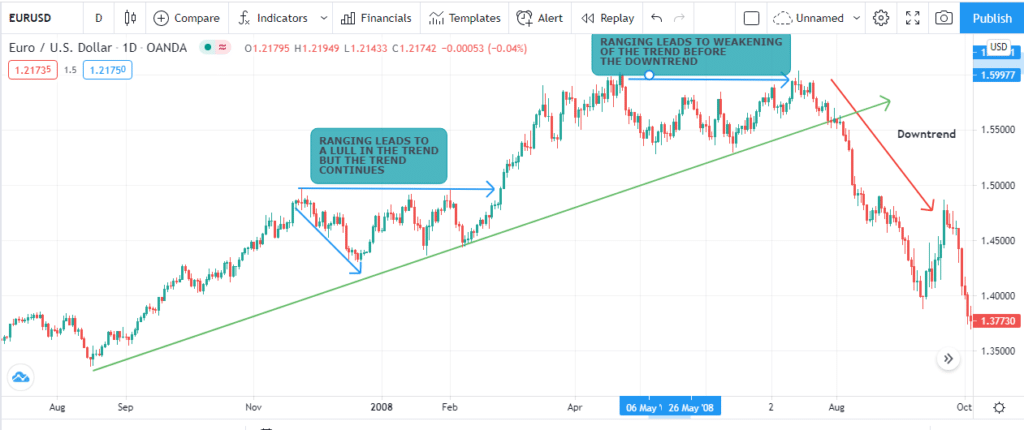
As shown in the EUR/USD chart below, the trend line defines a channel followed by the current trend.

The ranges have remained aligned to the trajectory of the trendline. However, a new trend is developed after the price crosses the trend line. Therefore, if you were following the trend, you should close your position at the point of intersection between the trend line and the price.
Identify trends with ADX
The ADX tells us two key aspects of a trade – the direction and its strength. When trading the trend, the direction becomes more important than the measure of strength. This indicator comes with three lines, with two of those showing us the direction.
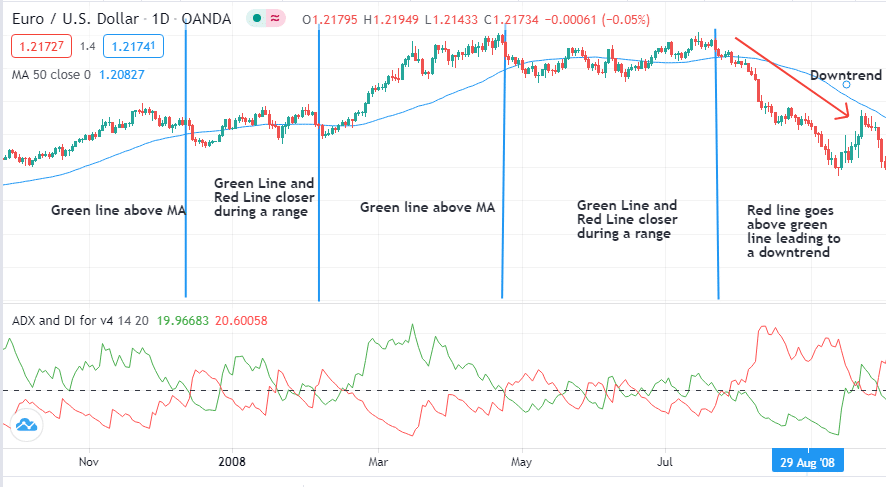
In the chart below, the green line tells us the trend’s bullish momentum, while the red one tells us its bearish strength.

The correlation between the two lines helps traders read the trend effectively. When the green line goes above the red one, it signals an uptrend. When the opposite happens, then we know that a downtrend is in play. The ranging period is represented by the closing of the gap between the red and green lines.
Bottom line
Trends are helpful guides for trading and are relatively easy to read. However, you should know the correct indicators to employ and get your timeframe right. Importantly, remember that trading is dynamic, and no method is 100 percent effective. Sharpen your skills through practice and experience, and always use the appropriate technical tools.


Leave a Reply