Gold as a commodity has always held its value for centuries. However, in recent years we can see the trader’s interest in trading gold decreasing. For instance, from the early 1980s right up till the 2000s, we have seen very little interest in trading this safe-haven asset in major stock markets of the world. However, there are still lots of profits to be gained if you can master gold trading in an efficient way. Over ninety percent of gold in existence is either made into jewelry or held for investment purposes.
How the US Dollar and Gold are related?
The true correlation between the US Dollar and Gold is one of the biggest points of contention for gold traders. Since gold is priced in US Dollars, one would assume that the two assets are correlated. This means that the value of the dollar and gold move in opposite directions. In other words, when the value of the dollar increases, it takes fewer dollars to buy an ounce of gold and vice versa.
The above view, however, is over-simplistic and is not applicable in all cases.

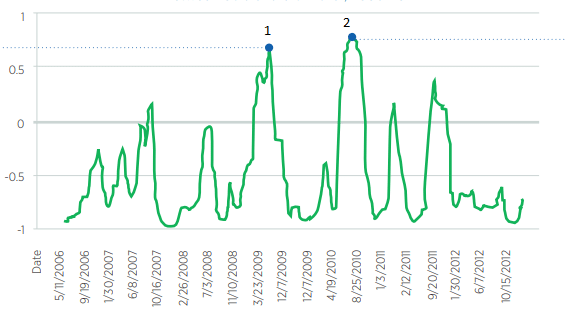
The above chart shows the correlation between the US Dollar and gold (100-day rolling), and measures how closely the movements of gold and the dollar has been in sync over the last 100 days. Here, a reading of 10 suggests that the two moved together in perfect sync, while a reading of -1.0 is an indication that their movements were diametrically opposite. The majority of the time, the correlation is negative which means the US Dollar tends to move in the opposite direction to gold.
Point 1 is an example of where gold shows a tendency to rapidly spike in periods of financial stress. This happened in the depths of the 2009 financial crisis and at the end of the first iteration of quantitative easing in mid-2010. This is due to traders purchasing both the dollar and gold in periods of uncertainty.
Point 2 is an example of a tough market condition where traders blithely traded. They have done this because they assume that gold and the dollar are inversely correlated. They are likely losing trades over the last few years.
Factors That Determine the Price of Gold
Gold is considered similar to currencies such as the Euro or the US Dollar because of its portability, durability, and level of acceptance around the world. However, it is still one of the most difficult financial assets to value. Unlike the above-mentioned currencies, an underlying economy of workers, companies, and infrastructure are not behind Gold.
In some other aspects, gold is very similar to commodities like corn or oil. This is because they come from the ground and possess standardized physical characteristics. The price of gold, however, fluctuates independently of its industrial supply and demand. Because of this, the behavior and emotions of traders is the main driver in this market.
One of the most reliable determinants of the price of gold is the level of real interest rate or interest rate less inflation. When interest rates are low, investment alternatives like bonds and cash tend to provide negative returns. This can push investors to seek alternative refuge to protect the value of their wealth. When interest rates are high on the other hand, the returns of cash and bonds increase. Thus, the appeal of holding gold diminishes by many folds.

Trading Strategies for Gold Trading
There is no “one size fits all “approach when it comes to any trading instrument and gold is not any exception. There are many technical trading strategies that are successfully employed in other markets and can be adapted perfectly to gold trading. This is due to gold’s ability to form durable trends. There have been many traders who have successfully used strategies based on oscillators such as RSI and Stochastics, trend lines, and Fibonacci analysis.
If you are a short-term trader, you can use the moving average crossover strategy to profit from frequent trends in the gold market. In this strategy look to buy gold if the short-term moving average crosses above the long-term moving average. Similarly, you should sell when the short-term moving average crosses below the long-term moving average.
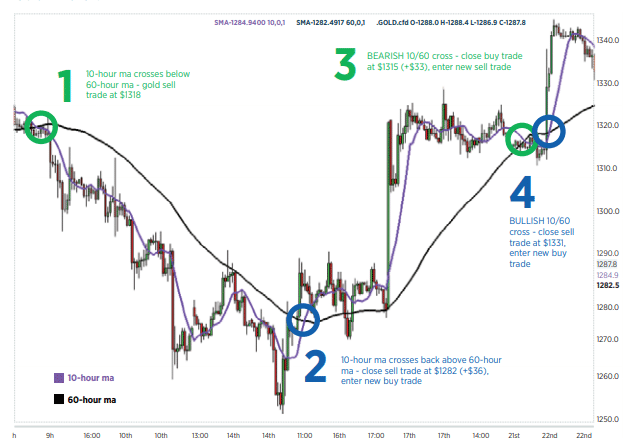
In the example below, we have taken the 10/60 time frames for the two moving averages. This can be great for short-term traders if they apply it on a one-hour chart. These settings have allowed traders in the past to successfully trade the middle of the trend, although there’s no guarantee of future performance.

#1: At this point, the short-term 10-hour moving average crosses below the longer-term 60-period average. This suggests that you should enter a sell trade as a bearish trend may be incoming. The MA does not cross again until at #2 a few days later. This is after gold has trended down to the $1200 range.
#2: At this point, the initial sell trade is closed, reaping a solid gain. It also triggers a new buy trade because the trend shifts back to the topside.
#3: This is the point where gold rallies back into the $1300s. The trade is closed on the bearish MA cross.
You have to note that this strategy also has a tendency to produce some losses as well. This is seen clearly at point 4, where the big spike caused the sell trade from the earlier point to be stopped out for a loss. The trade must be closed at the market price when the cross occurred, and not at the # level where the MAs actually intersected.
Conclusion
The above simple strategy can assist you to catch the middle portion of trends in more volatile trading environments. However, if you use it when gold is merely consolidating in a range, there’s a chance of experiencing losing trades as well. Thus, you might want to consider pairing up this strategy with other indicators to increase its long-term profitability.


Leave a Reply