Overview
In all financial markets trading, few technical analysis approaches are as precise as harmonic patterns. Harmonics are geometric patterns pinpointed through the use of specific Fibonacci ratios to outline very clear-cut turning points in the markets.
To appreciate harmonics is to appreciate the harmonic power of Fibonacci. These ratios exist in a variety of elements in the natural world, from flowers to the human face. Throughout history, analysts also began noticing that market retracements often landed on certain Fibonacci ratios. In essence, harmonic patterns are an extension of Fibonacci ratios as each point on every pattern is a decidedly accurate turning point based on a Fibonacci retracement.
Due to its high precision, traders can use better-defined stop losses and targets for these patterns. However, they can be highly complex since they are time-consuming to plot on the charts. Fortunately, various technical indicators can aid in scanning for harmonic patterns in the markets.
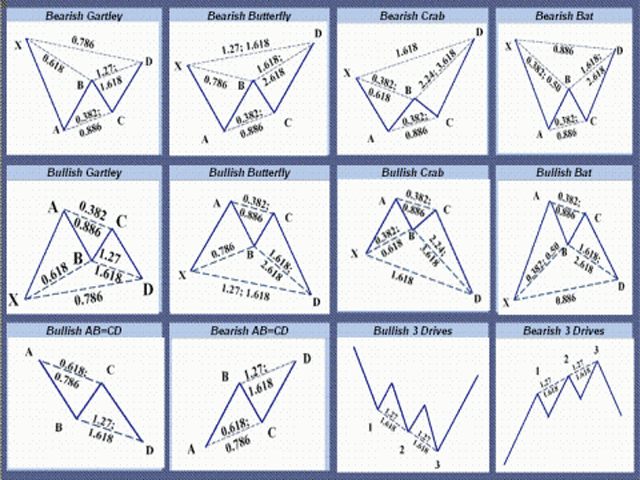
There are several harmonic patterns, all with their Fibonacci ratios and geometric points.
The most common patterns are:
- Gartley.
- Butterfly.
- Bat.
- Crab.
- Cypher.
- Shark.
- 5.0 pattern.
- 3 drives.
- Wolfe waves.
Arguably the most popular are the Gartley, butterfly, bat, and crab. Each harmonic comes with its specific Fibonacci ratios and rules. For simplicity reasons, traders should stick to one or two of these patterns to better familiarise themselves with their unique structures.
As with any element of technical analysis, harmonics shouldn’t be the only deciding factor for a trader to buy or sell. Harmonics merely provide a framework for thinking about turning points. To increase the probability of success for traders is incorporating several confirmations that could involve price action, Elliott Waves, etc. Elliott Waves complement harmonic patterns due to their shared relationship with Fibonacci ratios. Another vital point about harmonics is they are more potent on bigger time-frames.
First example of a harmonic pattern: the Gartley
The Gartley is often the first harmonic pattern that traders learn when introduced to harmonics as it’s one of the simplest. An interesting alternate name of the pattern is also the ‘Gartley 222’ or just the ‘222’ since this pattern is on page 222 of the 1935 book by H. M. Gartley, ‘Profits in the Stock Market.’ This book is the same one that first published harmonic patterns recognized by Gartley himself.
The Gartley can either be bullish or bearish and consists of five distinct geometric points, X, A, B, C and D:
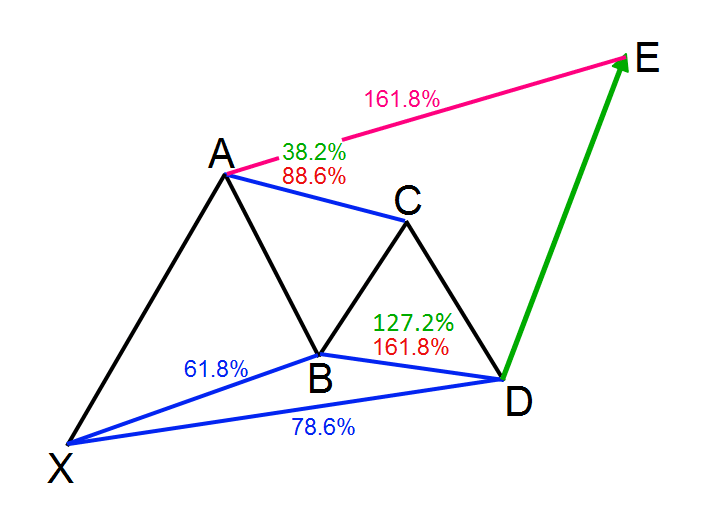
D is the entry point; X is where traders place their stops below: E is typically the profit target. There are a few components to this pattern, but the basic rule of thumb is:
- The XA leg is an impulse move. The retracement of leg AD is a two-wave move where leg AB equals to leg CD.
- The XA leg in a Gartley pattern is greater than the AD leg.
The actual Fibonacci swings are:
- XA can start from anywhere on the chart.
- AB is 61.8% of XA.
- BC is between 38.2% to 88.6% of AB.
- CD is either 127.2% or 161.8% of BC.
- AD is 78.6% of XA.
Trading harmonics is all about anticipation. Assuming the trader has correctly identified all the swings, they would wait to enter the market at point D with stop losses just below point X and profit target at point E, which is also the 161.8% extension of AD.
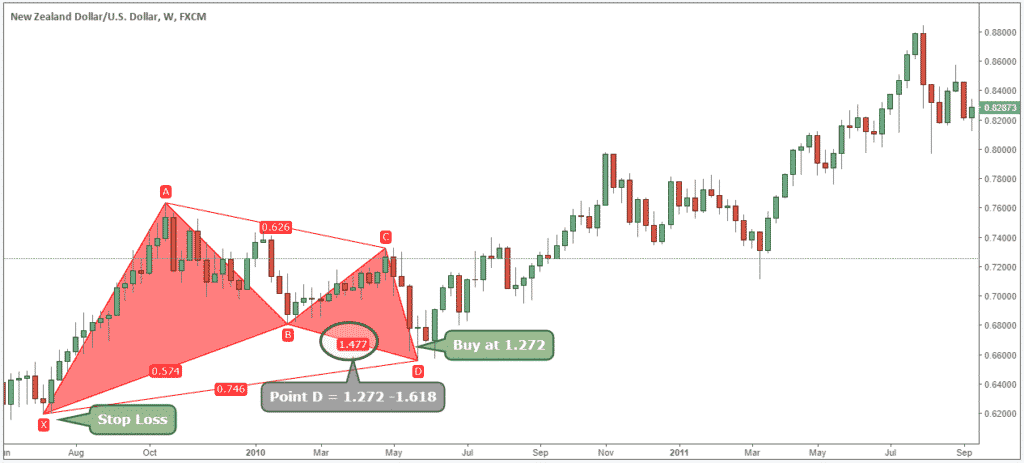
Below is a real chart example of how the Gartley looks. This image is an example of a bullish Gartley. From the D point, we can see a rally, demonstrating the power of these harmonics.
Second example of a harmonic pattern: the butterfly
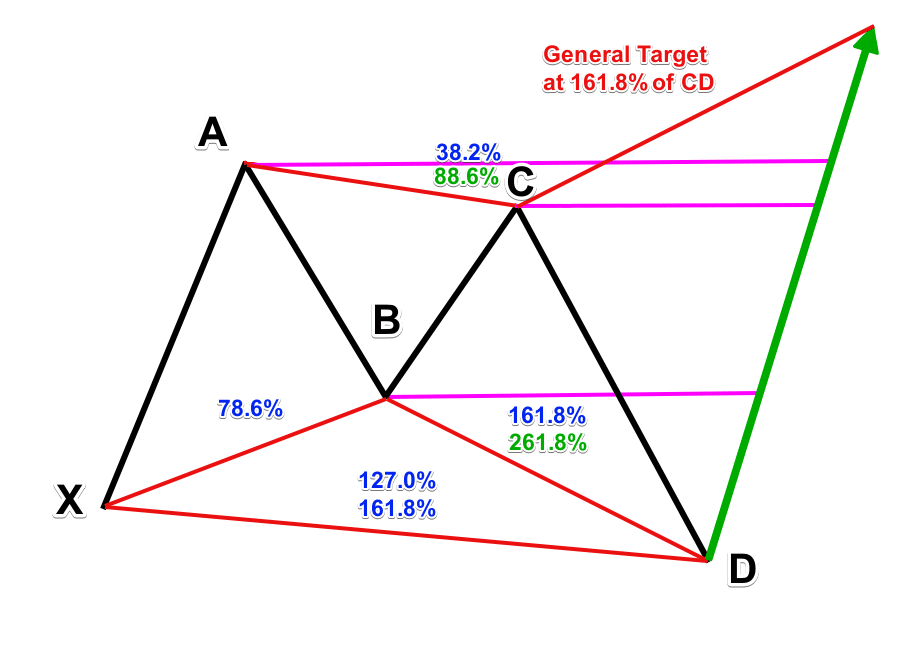
The butterfly harmonic pattern is also a staple for enthusiasts who trade these patterns. Visually, we could mistake the butterfly for a Gartley due to its very similar structures. Yet, upon close inspection, a few nuances are apparent that separate the two. The first difference is the A to D leg is longer than the A to X leg.
D is the entry point; traders place their stops below D; the 161.8% retracement of CD is the profit target. There are a few components to this pattern, but the basic rule of thumb is:
- The XA leg is an impulse move. The retracement leg AD is a special two-wave move.
- The XA leg in a butterfly pattern is shorter than the AD leg.
The actual Fibonacci swings are:
- XA can start from anywhere on the start.
- AB is 78.6% of XA.
- BC is between 38.2% to 88.6% of AB.
- CD is between 161.8% to 261.8 extension of AB or between 127.2% to 161.8% of XA.
Some traders plot harmonics without the help of technical indicators designed to scan for harmonics. However, those who are less confident can consider finding the best indicator that could confirm if they’ve plotted a particular pattern correctly.
Conclusion
Harmonic patterns have proven to be one of the most advanced and accurate in financial markets. As a result of its complexity, it takes only the skilled and experienced to master them.


Leave a Reply