Overview
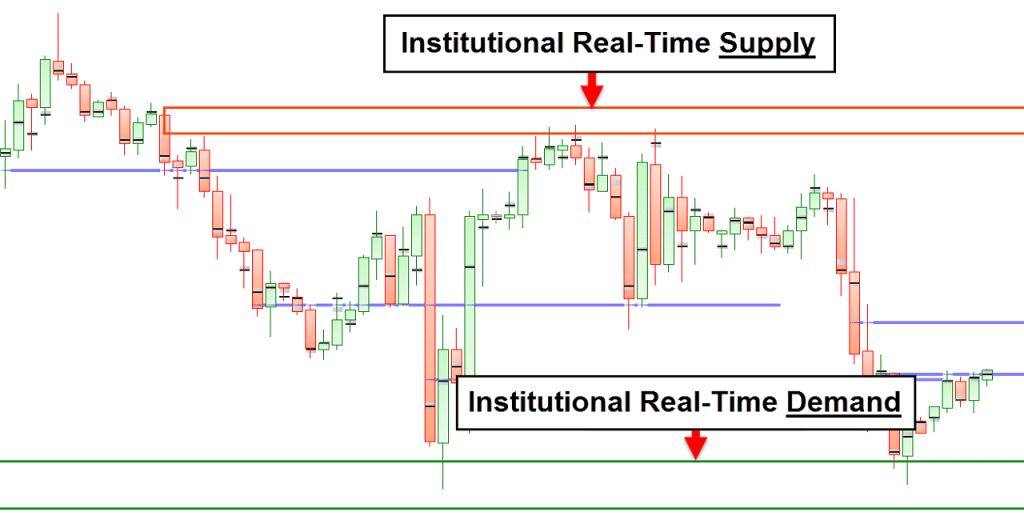
Order flow trading is one of the fascinating philosophies in financial markets. For the longest time, retail traders have always been interested in seeing the markets in the eyes of the so-called ‘big boys,’ i.e., institutional banks and other large financial firms. Though the idea of order flow is relatively old, interest has surged recently with the increase of trading strategies.
So, what exactly is order flow? Order flow refers to anticipating price movements based on the number of orders in the markets. On the surface, this idea sounds rather novel, though it’s quickly met with one main objection. In a perfect world, a resource that visually reflects all the orders made by millions of people on every broker available would exist.
Though the obvious obstacle is that since most markets are decentralized, it’s highly unlikely that the average person could gain access to such information. Therefore, traders attempt to anticipate order flow based on ideas such as price action, support and resistance, and other methodologies.
Order flow in detail
We should consider order flow as a perception simply as we don’t possess any real order book. While there are order flow indicators, as with most indicators, they aren’t very accurate. Oanda and AxiTrader are some of the brokers who claim they provide some form of order book, though, of course, this is only limited to their clients.
Before any big move begins in the markets, there’s usually a precise price level where it stemmed from. In any instrument, we must imagine that every price has a small to a large number of orders. Even at the current price, there could be active orders as far back as years ago that still have some small effect. The magnitude to which price moves is determined by the number of orders. For example, in a bull market, there are overwhelmingly more buy orders than there are sell orders. Retracements would occur by the sell orders and also by buyers taking profits, the latter of which gradually reduces the buying power in the meantime.
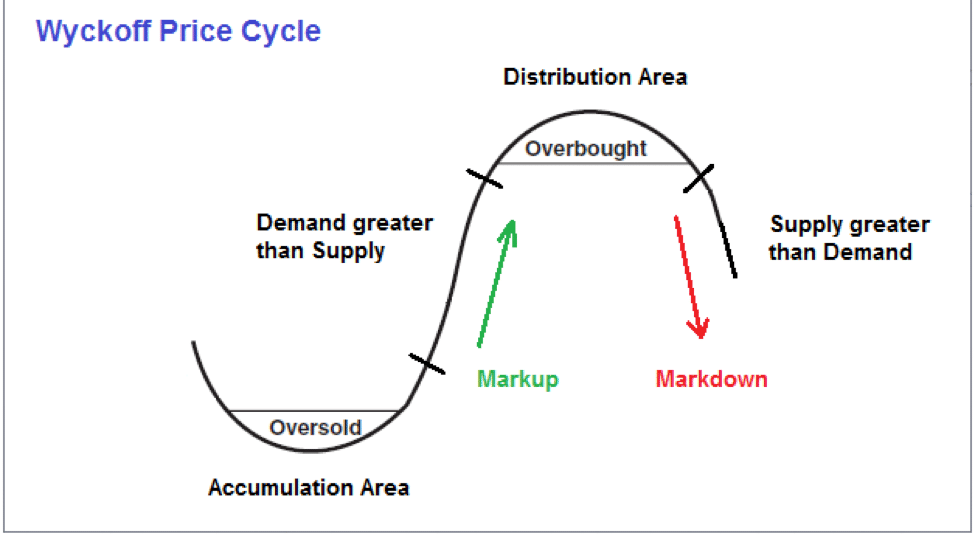
One theory related to order flow is Richard Wyckoff’s price cycle theory, which is one of the ultimate ways of understanding order flow. Four different stages exist with this cycle. However, we should focus mainly on the first stage, which is the accumulation stage.
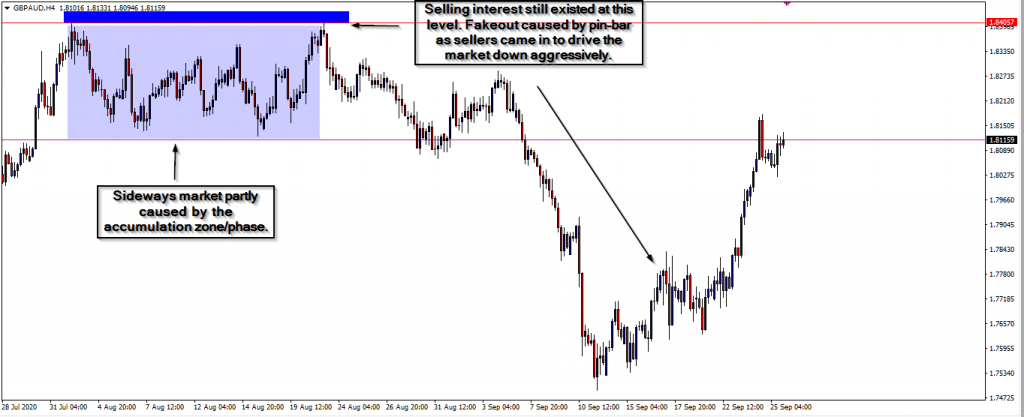
The late stock market authority theorized that in any trend, price tends to be in an accumulation zone whereby the big players gather up orders. The belief is that the they tend to wait for the opportune moment to cause a rally after accumulating enough orders at a particular level. They’d prefer to accumulate as many orders as possible to maximize profit. If the market rallies too soon from a level, more often than not, buying or selling interest still exists, and the market is very likely to come back to that area (as seen below)
Order flow enthusiasts usually attempt to forecast the point at which a sudden large number of orders (whether by market execution or pending) happen at a particular level. We commonly refer to this event as an imbalance of buyers and sellers. In the future, whether in a month or even a year, the same places can act in a very similar fashion since traders pay close attention to them.
These are the foundations of basic supply and demand. The belief is that there are predetermined levels where the power dynamics of buyer and sellers significantly shift. Of course, the market frequently invalidates even the most potent levels, though there still are plenty of chart examples that reflect markets can respect the same zones even years after.
Ways to exploit order flow trading
As with anything as dynamic in trading, there are a plethora of methods that we can utilize. In whichever approach we use, we cannot make assumptions willy-nilly. No matter the belief we may have on whether the market is imminent to produce the next big trend, these moments are usually rare and should precede solid confirmations.
1st method: using the supply and demand indicator
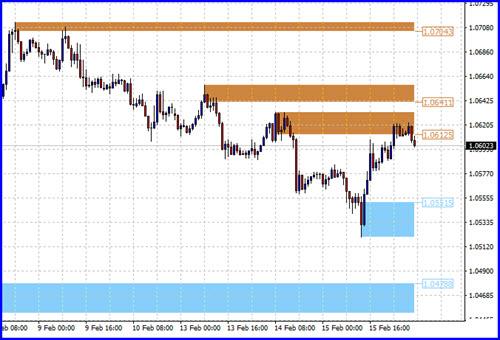
The supply and demand indicator is one resource that one can use to exploit order flow. This indicator attempts to plot specific price levels stretching far back as zones where big moves occurred. Visually, it’s an effective method of visualizing order flow and makes a trader anticipate what price is likely to do at a certain area. The indicator can also solve the subjectivity of drawing support and resistance manually since it provides a solid framework.
2nd method: price action (bull and bear traps)
Now when we speak of price action, we’re actually referring to a specific price pattern. Though there are numerous names for these patterns (most notably pin-bars), the key characteristic to observe with the candles are long-tailed wicks and small yet defined bodies. Alternatively, engulfing candles are also useful. In both scenarios, these patterns enforce the sudden emergence of buyers or sellers at a particular area. Let’s look at the picture below:
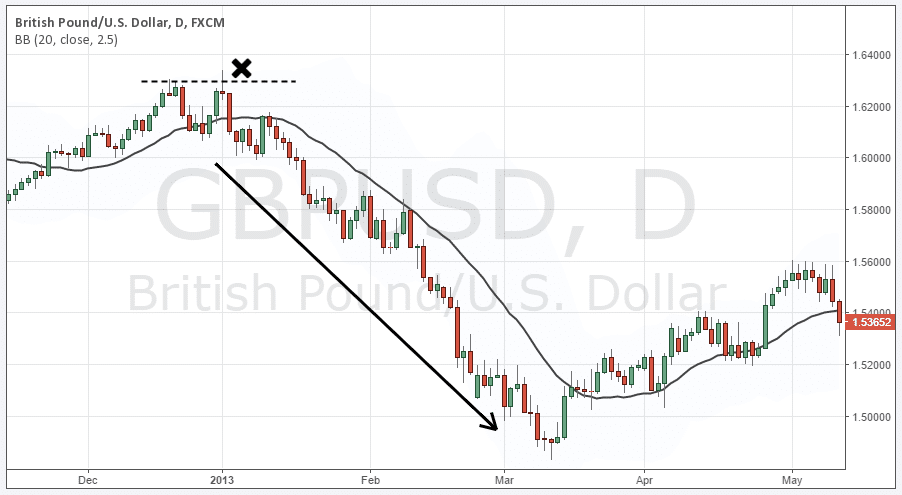
This image exemplifies order flow in action. Before the X mark, we were in a bullish trend. The accumulation zone is at the X. Two things happened here:
- While the market looked set to start trending downwards, there was still selling interest at that particular level (the accumulation zone).
- For ill-informed traders, they would have assumed the market was going to break out.
The second scenario (failed breakout) refers to a bear trap because the ‘bulls’ thought price would travel higher as a breakout, but they end up being ‘trapped’ where the bears enter suddenly and aggressively, driving the price down. Big players commonly cause these traps by exploiting the order flow where the majority starts piling up more sell orders than buy orders.
The candle pattern in the image of the long tail signifies the aggressiveness of where the bears suddenly came into the market. The pattern above is also known as a double top. Regardless, knowing that it forms by understanding order flow is what makes it such a popular pattern.
Conclusion
Comprehending order flow is one of the most potent strategies for trading financial markets. We cannot definitively know the exact order flow where most markets are decentralized. Therefore, we have to rely on the footprints left by the markets that provide high probability trade set-ups.


Leave a Reply