As an efficient way to read price metrics without distortions caused by volatility and minor corrections, the Heikin-Ashi (HA) pattern involves the use of candlestick charts with slight modifications for providing average price movement. Due to the averaged nature of the pattern, you will not find precise prices for close and open positions in a specific span.
About The Pattern
The formation enables easy readability signaling traders when to remain in a trade and when to exit. The simplified portrayal of prices is convenient to read, ensuring trend traders make confident decisions on their strategy.
The Japanese gist of the word Heikin is average, and pace is the English interpretation for Ashi. The two combined mean the average pace of a price. Created by a Japanese rice merchant, Munehisa Homma, the pattern enables traders to observe market behavior and capitalize on it.
Formula for Heikin-Ashi
Standard Heikin-Ashi
Knowing the formula used for this pattern enables traders to decide prudently when faced with complicated setups. Unlike the standard formation that features the price metrics distinguished by specific periods, the Heikin-Ashi uses slight modifications, which are shown below:
1. Close metric in Heikin-Ashi indicates the mean value of all four metrics for the existing period and is depicted by (Open + Close + Low + High)/4.
2. Open metric denotes the mean value of prior HA pattern open together with the close of the previous HA pattern depicted as (Open of preceding bar + preceding bar’s close metric)/2.
3. The high value denotes three rate points as maximum as the maximum value of close, open, or high of the existing span.
4. The low shows the minimum rate of the three value points as the minimum value of close, open, or low of the prevailing span.
Interpreting Heikin Ashi
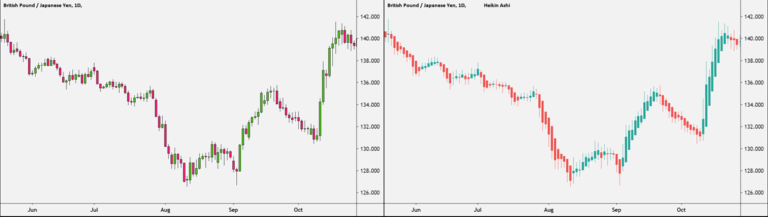
The upper shadow or wick characterizes high prices, and the lower shadow/wick denotes the low metric, while the body indicates the close and open. If the close metric is found below the open, it’s shown as a red candle, and it’s shown as a blue candle if it is over the open.
Every candle signals the relationship of various price points, revealing how a price had ended compared to its starting phase. In general, the candles remain green in an uptrend, and during a downtrend, they remain red, which is not seen in the standard Japanese formations that have both colors, in spite of the single directional price movement.
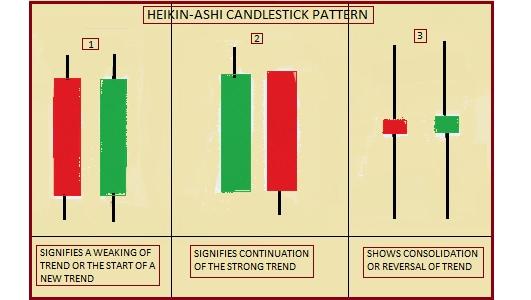
With green candles, a trader can add a long position and come out of the short positions. And, it is possible to exit long and add to short in case of a green pattern. A trend modification is implied if there is a tiny body with lower and upper wicks, which is used by traders who are not afraid of risks. Still, others patiently wait for authentication before entering short or long positions.
The selling pressure is stronger if you find a small upper wick with a long down pattern, and the buying pressure is robust if there is no lower shadow or longer up pattern. If both upper and lower wicks are long, it indicates indecision and is usually denoted by a filled and a hollow candlestick.
Benefits of Using the Pattern
Although the format does not reveal the exact value every time, it helps spot the course of a movement. The formation is used to spot trade setups, wedges, or triangles, as in other charts.
In the image below, you can find consecutively arranged filled and hollow patterns with a falling wedge, making the stock break resistance. This leads to an upsurge in the early part of November.
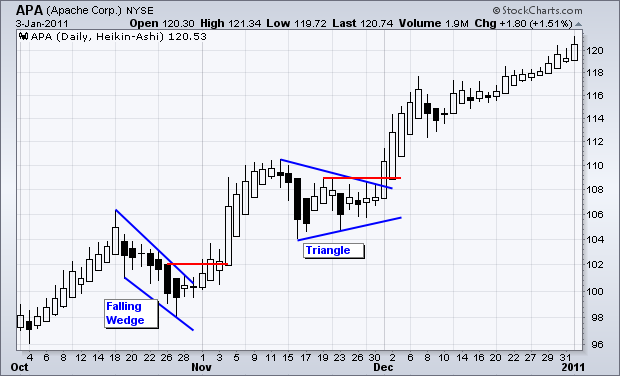
Triangle consolidation gained impetus as the stock strengthened. The breakout in the upside is indicative of a larger continuing uptrend.
Final Takeaway
With Heikin-Ashi, a beneficial trading tool is available that ignores the unnecessary happenings, foreshadows reversals, and helps you spot the classic patterns. You can find resistance and support metrics and also know about the volume and direction of the movement of rates. For isolating the prevailing trend, this is undoubtedly a perfect chart to use.


Leave a Reply