There are numerous indicators used by traders to figure out points of entry/exit for a trade. One such indicator is the Accumulative Swing Index. It is a significant tool among the various trendline indicators that allow traders to identify signals for buying and selling of currencies on the market. In this article, we take a look at this tool/indicator that will help you do exactly that and use it for confirming trends. Not only is it ideal for generating signals but also for confirming trends.

What is the Accumulative Swing Index?
A variation of the Swing Index, developed by Welles Wilder, the Accumulative Swing Index is a tool that is used to gain a better understanding of the long-term picture.
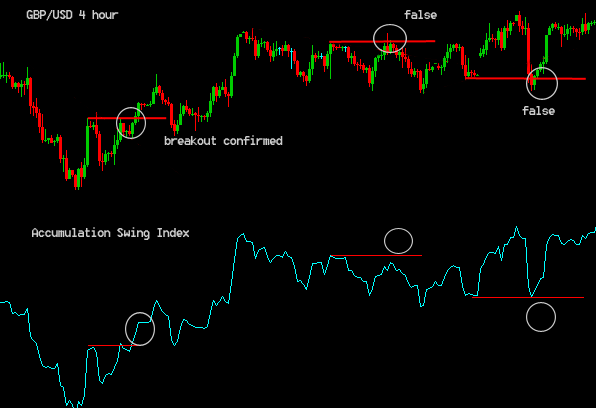
The ASI line trends fall between 100 and -100. Since the index is centered on price, it follows the basic candle-pattern of price. As such, it can be used to analyze multiple securities, including currencies. ASI is well known to provide confirmation of a breakout.
After it is calculated, it can be compared with the candlestick price chart. The ASI’s importance is proven by its determination of multiple chart patterns to ascertain resistance and support levels.
The ASI trend-line can be used to double-check the assumptions based on technical analysis. This helps in decrypting the signals for trading. For traders, ASI is a handy tool and utilized to generate buy/sell signals as well as for confirmation and divergence.
Another important feature of ASI is that it is smoother and easier to read and understand than candlestick charts. They are also less prone to giving out false breakouts.
What is a flat market?
When the value is near zero, there is no trend in the market, also called the flat market. The most obvious characteristic of this is that there is no swing. The line seldom crosses the approximate zero level in any remarkable way. Even when it does, it does so only slightly.
ASI as a confirmation tool
Traders use ASI to confirm when the trendlines are breaking out. This is done through a comparison between ASI trendlines and price chart trendlines. A false trend breakout is indicated when there is a mismatch between the ASI and price chart trends.
As a potential buy signal
When the ASI moves above the downtrend, the trader can look at it as the buy signal. Similarly, when the price enters a consolidation period and is above resistance, then a trader can look at it as a potential buy signal.
As a potential sell signal
On the other hand, when ASI moves below the uptrend, a trader can look at it as a sell signal. Similarly, when the price is in the consolidation period and below support, a trader can consider this as an equally good potential sell signal.
Conclusion
The Accumulative Swing Index works as an important trend indicator that lets traders find signals to trade. Though it was developed as Swing Index, ASI is its cumulative value for every single time-frame over a particular period of time. It lets one get the confirmation of trends from other patterns, so it is considered one of the most important indicators to know about.
This indicator is easier to understand and not as susceptible to false breakouts compared to other indicators. Since it is centered on price, it usually follows the candlestick price pattern. The indicator can be applied not only to currencies but also to futures and stocks.


Leave a Reply