Fibonacci retracement, what is it? As you may know it, investment markets use natural comparison or studies from other research fields such as oscillation, momentums, and in this case, the Fibonacci sequence.
The Fibonacci numbers are everywhere in the world. Yes, it is a mathematical sequence, but it is well presented in nature, music, computational analysis, and in optics among other fields.
Investors and Forex traders love Fibonacci numbers. They use it to forecast possible movements in pairs. I am pretty sure you have heard about Fibonacci retracements, but there is more: Fibonacci extensions and sequences.
Today, we are going to talk about the world of Fibonacci in Forex.
What is Fibonacci Retracement
Fibonacci retracement is a technique used in technical analysis for the identification of supports and resistances, and other critical levels for a trading position such as entry point, target prices or stop losses.
Retracement numbers are based on the Fibonacci sequence, named after Italian mathematician Leonardo of Pisa, also known as Fibonacci. It first appeared in 200 BC in India in a work written by Pingala about possible patterns of poetry. However, it was in 1202, when Fibonacci introduced the sequence to the west in his book Liber Abaci.
As a matter of context, in the Fibonacci sequence, each number is the sum of the two preceding ones starting from zero and one.
Fibonacci Sequence numbers are: 0, 1, 1, 2, 3, 5, 8, 13, 21, 34, 55, 89, 144, 233, etc…
Fibonacci numbers are static numbers, so does retracement. They do not change. Levels are associated with a percentage and are plotted as horizontal lines which indicate possible supports and resistances.
The retracement levels are created by taking highs and lows as extreme points and then dividing the vertical space between both prices.
The Fibonacci retracement levels are 23.6%, 38.2%, 61.8%, 78.6% and 100%.
Usually, technical traders who use this technical indicator also apply the 50% as a Fibonacci ratio because of its psychological condition.
Technical traders love Fibonacci sequence in applied in Forex as it is easy to use. Fibonacci numbers can connect two points that any trader believes as relevant high and low levels.
How to calculate Fibonacci retracement levels
As Fibonacci sequence and retracement levels are static numbers, there is really nothing to calculate when it comes to the use of the indicator.
You only have to take the percentage of the decline or advance between the two levels you have chosen. Then, it will be your numbers. It doesn’t matter about prices, but about percentage changes.
That being said, the most critical level in the Fibonacci Retracement tool is the 0.618, or 1.618 in both cases retracement or extension. It is because this number is like a magic number which is also called the Golden Ratio, also called Phi.
How Fibonacci levels work in Forex
Fibonacci retracements are widely used as entry orders, profit target, or to determine stop losses in Forex.
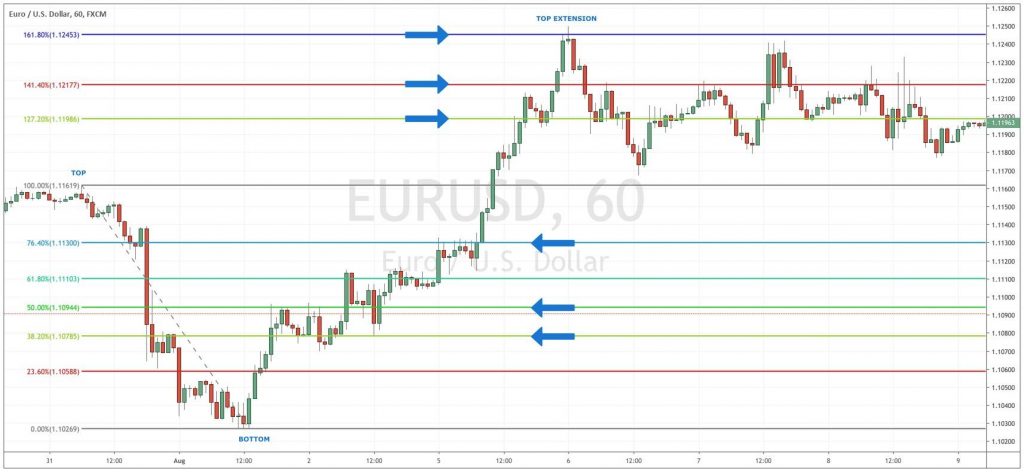
For example, if the EUR/USD falls from 1.1161 to 1.1029, it is the decline that will set your Fibo levels. Then, the retracement will happen after the price recovers from the low.

As you can see, the chart shows that the retracement was surgical at the 50% Fibo level of 1.1094, then the golden ratio of 61.80% at 1.1110, and the 76.40% at 1.1130.
Those levels were good price targets to get profits after opening a position at 1.1050, where the price confirmed an upside recovery from its lows.
Traders usually take stop losses from Fibo retracement too. If you are a contrarian trader, you may want to take a long position at the 38.20 Fibo retracement level after the price hit it at 1.1078. Then, you can set stop loss at 1.1058, where 23.60% is. Then, profit taking would be at the 76.40% level at 1.1130.
Then, as for extensions, prices tend to go up to the golden ratio of 161.80% Fibo level, this time at 1.1245. It would be a great profit target if you use trailing stop losses.
Fibonacci retracement signals
Fibo retracements may signal a trend reversal, but also a continuation after a period of consolidation. As a bounce is expected to retrace a portion of the previous decline, and a correction is a retrace of the prior advance, it is easy to understand how Fibo levels work in a chart.
Usually, a retracement doesn’t fill the 100% of the levels, so, it is crucial to understand that middle levels can also signal a change of trend or even an extension of the movement.
A retracement could also be just one sector and then a continuation of the prior movement. So Fibos are also good anticipating the lasting of a pullback, bounce or correction.
That’s the reason that like any other technical indicator, Fibonacci retracement works better with the combination of other studies such as momentum, volume, or patterns from candlestick charts.
Pros and cons of Fibonacci in Forex
As mentioned before, Fibonacci retracement will work better with the combination of other indicators. Fibo has its ups and downs as any other technical study in Forex.
Fibonacci Pros
It is subjective: Many people believe that it is a con as levels usage is subjective, and traders can use it in different ways. However, here in Forex Traders Guide, we believe that differences make us strong. Look for levels that are not so popular and think out of the box; it will pay you back.
Fibonacci Cons:
Illogical: There is no logical proof for the reliability of Fibo levels, but it works. So, you have to believe in the indicator, no matter what your common sense tells you. That being said, follow your intuition and never trade what you don’t believe. Fibo is good, but it is better if combined with other tools.
It is retracement: Obvious, isn’t it? Well no. Remember that Fibonacci in Forex provides signals for correction, reversals, and bounces. It also gives you entry points, but nothing else.


Leave a Reply