Breakouts are rewarding patterns for trading volatile markets as they allow traders to profit early on as a new trend begins. However, many, at times, breakouts are often plagued by false signals resulting in false breakouts.

Table of Contents
What is A False Breakout?
As the name implies, a false breakout occurs when price moves above a critical resistance level or below a key support level and immediately followed by a reversal. Instead of quotes edging high or tanking, it retreats to where it started. The failure of price to hold a broken level as a new resistance or support results in a fake breakout.
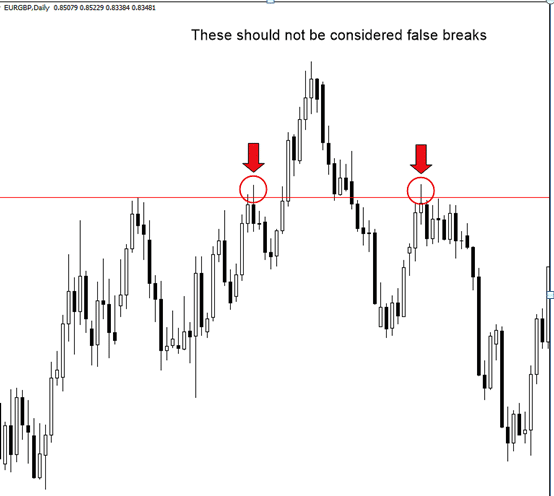
Breakouts are expected to continue moving beyond a given level. However, that does not happen all the time, resulting in false breakouts. When the price retreat to where it started after breaking a key level, traders are likely to see the crucial price action trading pattern.
A false breakout may signal that price is about to change direction and start moving in the opposite direction. Similarly, it can signal that the underlying trend is about to resume after a period of consolidation.
How Do False Breakouts Happen?
False breakouts come into being on traders triggering positions purely on emotions rather than logic. Whenever a subset of traders triggers positions at the support and resistance levels because they feel like doing so, it often results in false breakouts that don’t hold long.
False breakouts happen whenever traders open positions whenever the market is quite extended in a given direction in the hope that price will continue moving in that direction. Some traders also try to predict a breakout from a key support or resistance level quite early, resulting in false breakouts.
The markets tend to correct themselves whenever false breakouts occur as professional traders always maintain a watchful eye towards these missteps by amateur traders. It takes a lot of discipline skills and experience to identify false breakouts as they don’t happen too often.
How to Detect False Breakouts?
A breakout is valid only when price closes above or below a resistance level. If the close is immediately followed by a price return below the resistance level or above the support level, the same should be billed as a false breakout.
Tech analysts insist that a breakout is valid when the price rises above a resistance level or tanks below a support level by more than 3%.
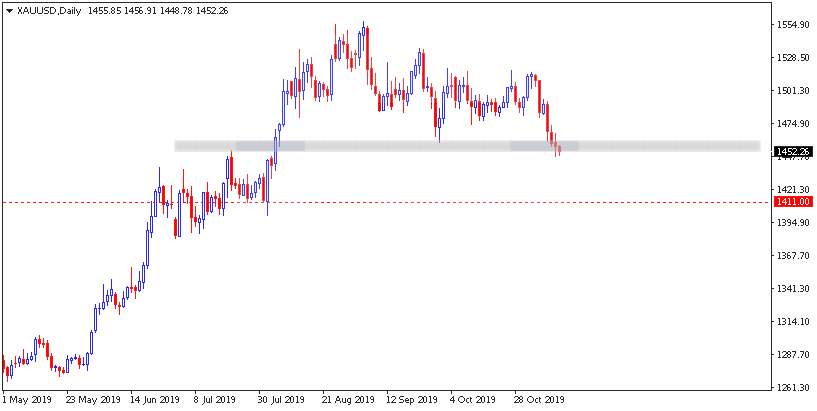
In the chart above, support is at 1455. Applying to the 3% thumb rule the price will have to drop and close below the 1411 level to hold the breakout. A decline to 1440, followed by a bounce-back, will signal a false breakout and price likely to continue edging higher.
How to Trade Fake Breakouts
Fake Breakouts: Trend Continuation
The best way to trade false breaks is to try and be in sync with the long term trend as it appears in a daily or weekly chart. Whenever a false break occurs against a dominant trend, the likelihood of price correcting and moving in the long-term trend is usually high.
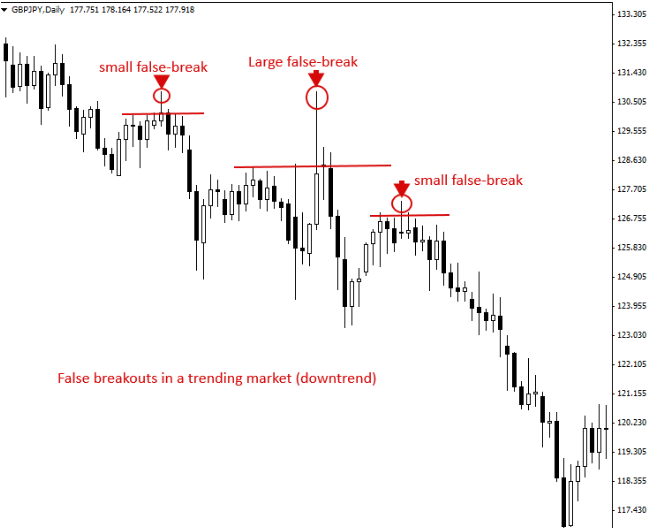
In the chart above, it is clear that the price tried to move up, breaking key resistance levels three times. However, with each break, the price often retracted and continued to edge lower in continuation of the long term downtrend.
In the chart above amateur, traders tried to pick a bottom, assuming that price was ready to correct higher. However, that was not the case as a false breakout was immediately followed by a ferocious sell-off after price failed to hold above the resistance level.
False Breakout: Range Trading
False breaks are also common in ranges as some traders try to predict a breakout after an extended period in a range. Most of the time, price bounces back or pulls back after trying to break a key support or resistance level in a range.
Knowing that false breaks occur when a market is in a range is valuable information that allows professional traders to generate significant returns. In this case, buy positions are triggered at the lower end of a range after a false break to profit on price rallying to the higher end of the range, i.e., resistance level.
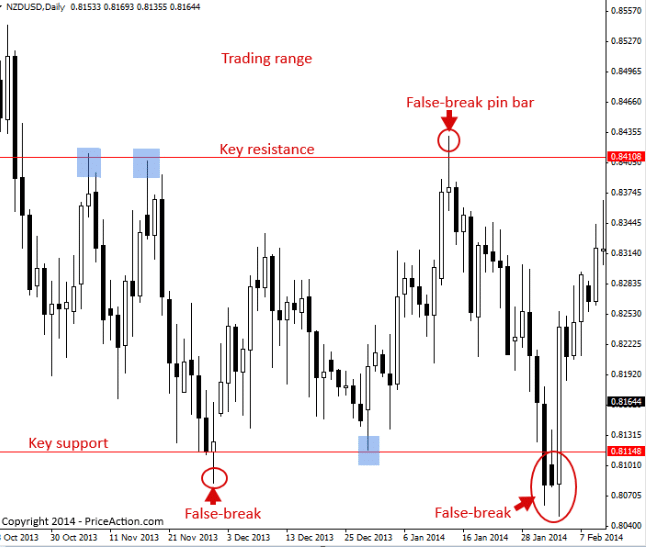
Similarly, traders leverage false breaks above a resistance level to enter a short position, hoping that price will collapse, edge lower to the support level. In the chart above, we can see that the price pulled back or bounced back as soon as it tried to break out of the range.
False Breakouts: New Trend Confirmation
False breakouts can also signal the commencement of a new trend in the long term trend reversing. In the chart below, it is clear that the GBP/USD pair was trending upwards. However, after testing a key resistance level three times, a pin bar false breakout occurs.
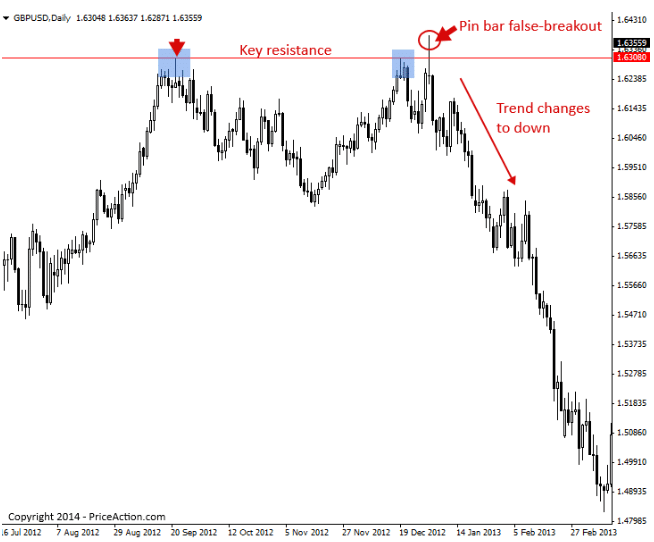
The pin bar false breakout candlestick signals that the upward momentum has lost its edge, and that price is likely to edge lower, which it did.
How to Avoid False Breakouts
The best way to avoid false breakouts is not to trade in real-time as soon as price breaks a key support or resistance level. Rather than acting on a trade immediately, wait for a candlestick to close above or below a key level. Traders should wait for a 3% move in price in the direction of the breakout.
Likewise, it is important to place entry orders some percentage above or below a key level to get into trades in case of breakouts automatically. The entry order, in this case, should take into consideration the possibility of a false breakout.
Conclusion
False breakouts are valuable trading patterns. They signal price is likely to retreat and continue to move in a range or sync with the long term trend. It occurs when the price temporarily breaks support or resistance level only to retreat to where it started. False breaks happen in trending and range bound markets. Similarly, they occur against the trend.


Leave a Reply