Elders triple screen strategy is a trend following strategy commonly used to profit in the forex and other markets. Unlike scalping, swing trading, or positional trading, the triple screen strategy works by analyzing chart patterns in multiple time frames.
With triple screen elder’s strategy, the idea is to try and time trade entries with market corrections and pullbacks. Likewise, people as well as forex robots open positions, either short or long, when signals in different screens and time frames are in agreement.
Table of Contents
Step 1: Identifying Chart Set Up
The elder’s three-screen strategy involves filtering trading operations by focusing on the largest time interval. In addition, a person or a forex trading instrument can only identify entry and exit points using the smaller time intervals. The approach, therefore, increases the chances of accruing large profits at the least risk.
The first step, in this case, is to choose the chart depending on the trading approach one wishes to deploy.
| Screen Style | Strategic Screen | Tactical Screen | Executional Screen |
| Long Range (Positional Trading) | Weekly | Daily | 4 Hour |
| Mid-Range (Swing Trading) | Daily | 4 Hour | 1 Hour |
| Short Range (Intra Day ) | 4 Hour | 1 Hour | 15 minutes |
MACD and Force Index are the two best forex indicators used to read and interpret screens in the triple screen strategy. The two momentum indicators in this case act as filters giving initial signals for transactions.
Whenever the MACD columns decline and cross the zero mark from top to bottom on the strategic screen, the same is interpreted as a downtrend. Similarly, whenever the MACD columns are rising and cross the zero line from bottom to top, the same is interpreted as an uptrend. The strength of the trend, in this case, is determined by the size of the histogram. The larger the histogram, the stronger the trend, and the greater’, the profit margin.
The MACD indicator can give false signals from time to time. To counter false signals, one ought to use a 13 Exponential Moving average. When the price of an asset is above the 13 EMA, a trader should focus on going long.
When the price is below the 13 EMA, a trader or an algorithmic FX trading system should focus on going short. When the price is moving sideways and the moving average is flattened. Refraining from the market should be the call.
When there are conflicting signals between the MACD and the 13 EMA, the focus should be on the 13 EMA.
Step 2: Entry and Exit Points
| Triple Screen Entry Rules | ||||
| Strategic Chart | Tactical Chart | Executional Chart | Action | |
| Up | Down | Up | Go Long | |
| Up | Up | Up/Down | Wait | |
| Down | Up | Down | Go Short | |
| Down | Down | Up/Down | Wait |
When to Buy On Long-Range Trading
The best time to enter a long position in long-range trading is when a bull trend has undergone a correction after an extended period on the downside.
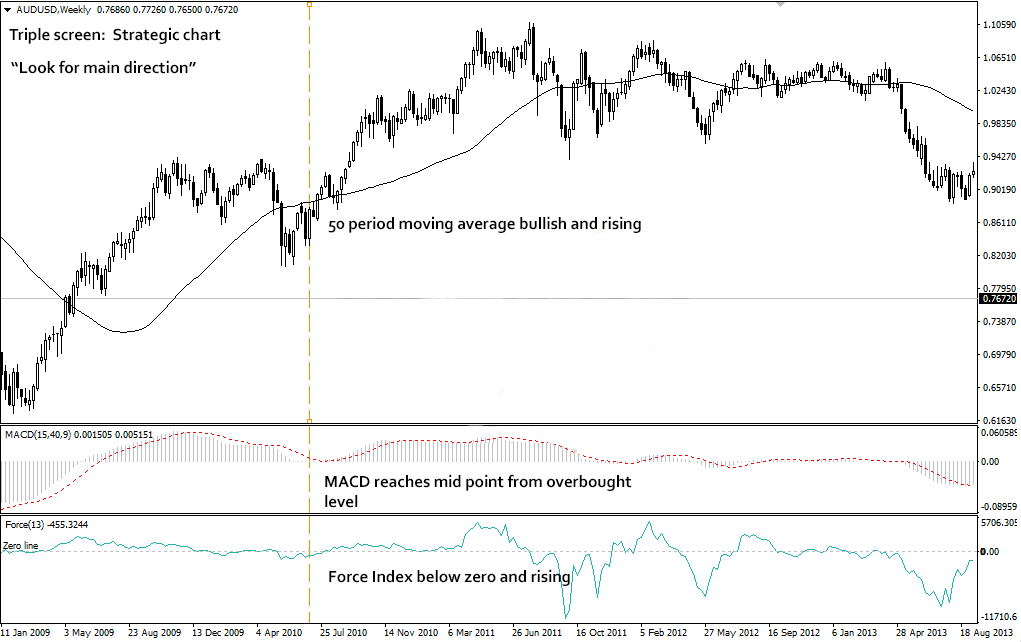
Look at Weekly Chart
In the weekly chart, we use the 50-week simple moving average to ascertain the direction in which the price is trending. If the price is above 50MA, it means long positions have a high chance of generating profits.

The next step is to wait for the MACD line to ascend from the oversold condition signaling a change in the direction of the trend to an uptrend. Conversely, it is also important to ensure that the Force Index is below the zero line.
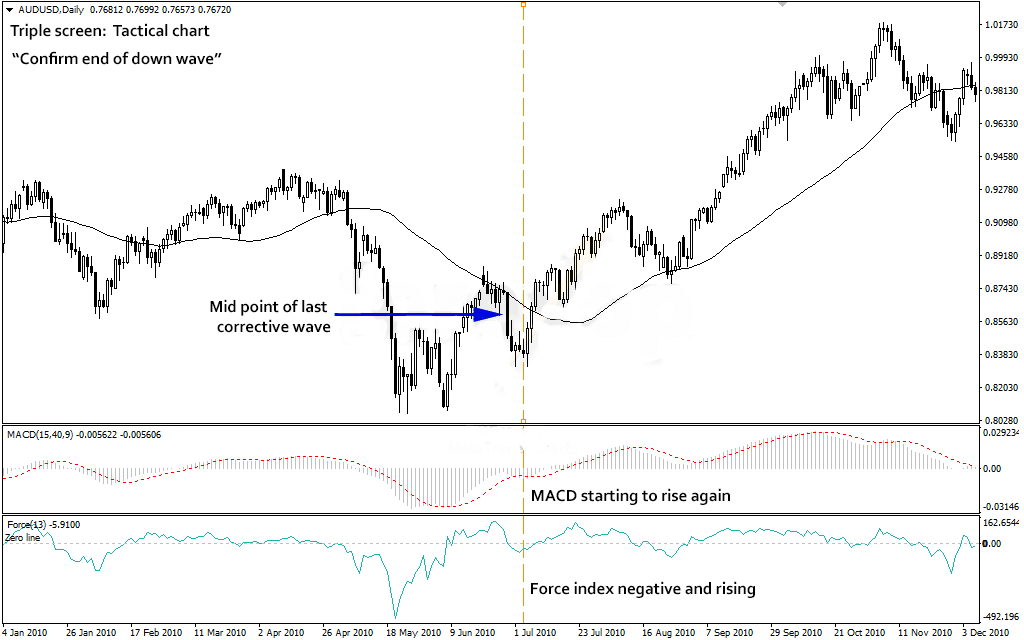
Look at Daily Chart
The daily chart is the next chart to pay close watch to, in long-range trading. In this case, we will use the MACD and Force Index to confirm that the correction is completing. The daily chart is used to ascertain whether the selling pressure from a correction is reducing.

The idea, in this case, is to ensure that we are at the start of a new bullish trend. If the downward correction is still strong, then abstaining is essential.
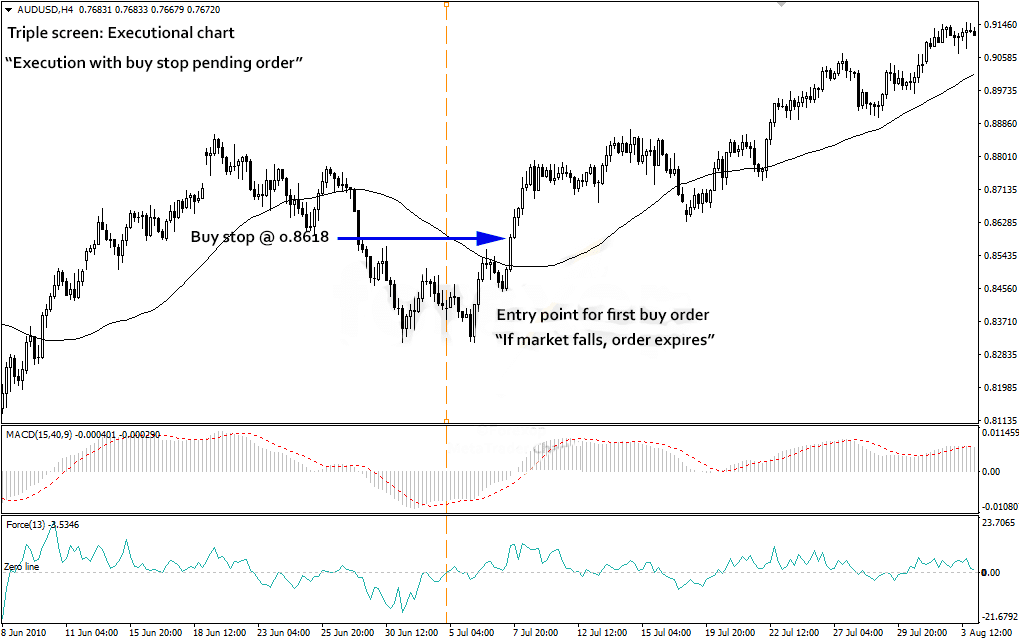
Look at the Hourly Chart
The hourly chart is the executional chart that provides an ideal entry signal. On this chart, traders or automated forex trading systems should look for the optimum time to execute a trade. In the case of long positions, there should be a strong bullish candle as price emerges from a bearish trend.

Orders should be placed as pending buy stops as important money-making hack. A buy entry would execute when the price rises above the current market level
Step 3: Exit
A stop-loss or trailing order should be used for risk management. Likewise, a stop loss in case of a long position can be placed a few pips below the entry point. Similarly, trailing stops can be used to lock in as much profits as possible and take care of price reversals.
Bottom Line
Elder’s three screens strategy is a trend following strategy that works best in several markets. The trend trading strategy involves studying chart patterns in three-time frames. One is likely to generate profits on opening trades in the direction of a trend when the three charts are in sync.


Hi
My name is Jamal
Thank you very much .
The education was very usefull to me or any trader who is beginner like me .