- Suez Canal blockage affects the oil supply, and USD/CAD falls, creating pressure on the market trade.
- Crude oil prices bounce and break the resistance of $66.37 higher than the monthly pivot level and continue to move.
The positive momentum of crude oil is underpinned by fears of weeks in the Suez Canal’s being unblocked and that the oil supply to consumers is seriously delayed. Until now, it was believed the grounded container would be released by Saturday night, but those reports are not convincing indicators. The owners are reported to be losing $400 million per hour for goods delayed due to the channel’s blocking.

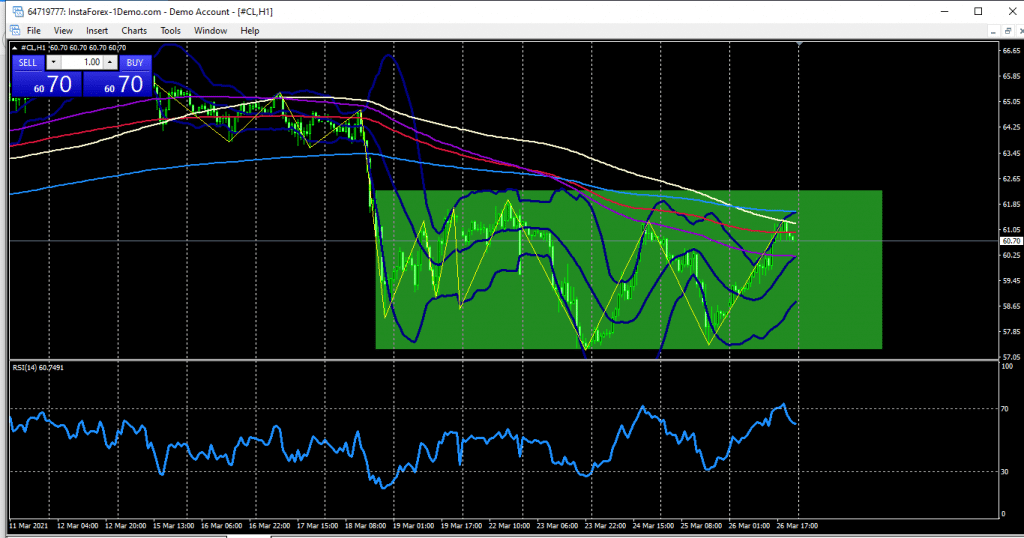
The worsening of the global pandemic situation, especially for large energy consumers such as Europe and India, obstructs a major rise in oil prices. We can see the rectangle range has blocked the trending momentum of crude oil. Now, crude oil is struggling near the hourly 200 periods moving averages around $60.65 area. As there is no fundamental news until the US session price can bounce between the upper and lower part of the hourly rectangle.
The oil price traded for several previous months is in an upward direction supported by the Ichimoku cloud. During this month’s price movement, the price rises this April above the monthly pivot level of 59.00.
The price headed to the first monthly resistance level of 66.37, which brought the price in an upward movement, and is currently trading in a sideways movement above the Ichimoku cloud level and above the monthly pivot level and thus the direction of oil is considered in the long term. The average is unclear, as oil could drop for further correction to the lower cloud line, and oil could rebound above the current level to complete the upside move.
USD/CAD loses as crude oil continues rising
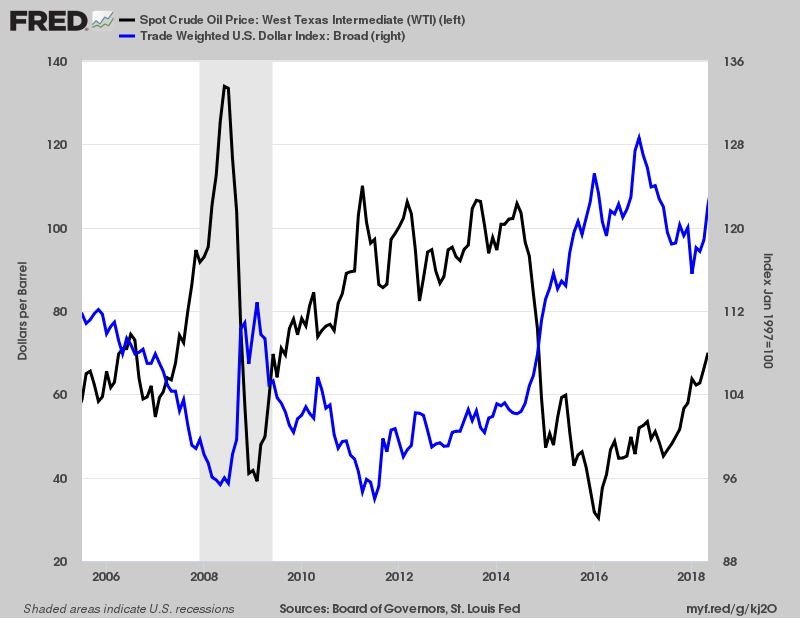
The important factor of trading crude oil is the relation with USD/CAD. The currency pair has been seen extremely losing, which might force or create pressure on crude oil to go upside in the long term. In this situation, traders can open a sell trade of more than $65 per barrel area but use minimum lot size. Crude oil is inversely proportional to USD/CAD for about 93% because when oil goes up, the USD/CAD goes down, and vice versa.

Never use stop loss more than 2-3% of the account size. It would be a gamble like orders, not trading. You can see how for a couple of weeks, oil prices fell 450+pips. However, this week put oil in an uptrend that was not gambling, simply trading.
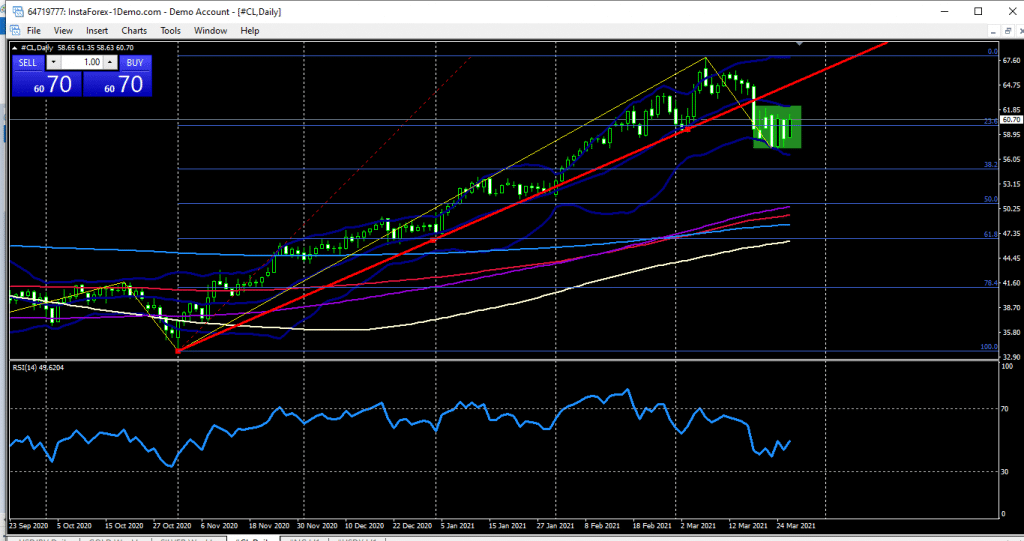
On the daily chart of oil, the price is facing strong resistance from the monthly resistance 66.37, as the price tries over the days to breach the level, but the price continues to move sideways below the resistance, unable to break it up.
In the past, the price movement was in a downward trend for several months. At the beginning of this month, the price rose to the monthly pivot level of $59, which has a price bottom that has risen to the resistance level, and therefore the price is still giving a bullish price behavior with the possibility of a correction from the current levels to the monthly pivot level.

The level of buying oil on a daily chart is when the price bounces higher when the monthly pivot level is reached. The second level to buy after breaching the resistance 66.37 and closing the day above it.
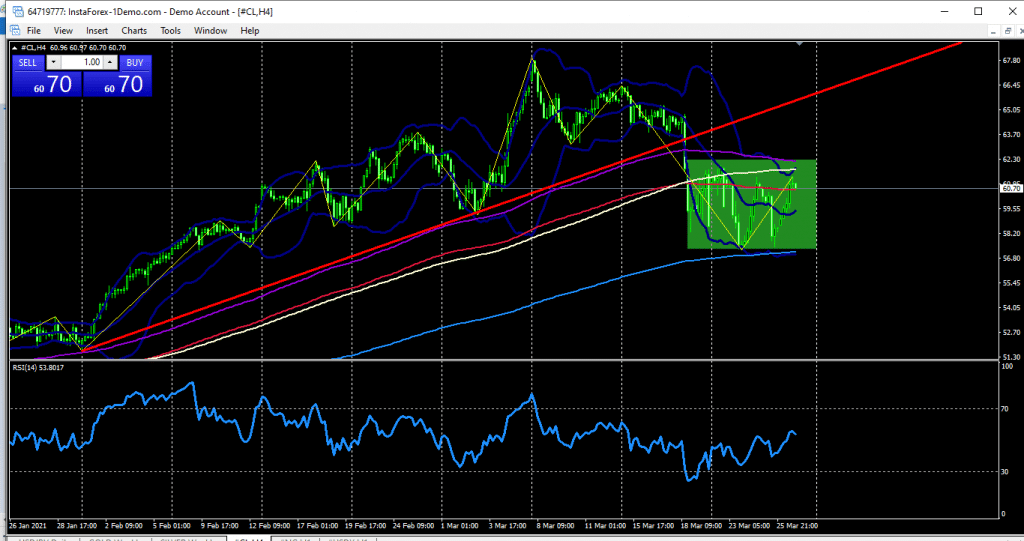
On the four-hour chart, too, we can see the rectangle sideways marked. The upper region of the rectangle is around $61.70 area, above which if the price breaks out, we could buy confidently. But the current COVID situation has created a third-wave lockdown on European countries that could lead to further falling unless the production is decreased. Right now, the price should be ranging between four-hour uppermost and lowermost 200 periods moving averages. So sell from above the $61.50 area and buy from the $57.50 area to use the swing momentum.

During the previous week, the sideways movement of oil is more evident on the 4-hour chart. The price faced strong resistance from the cloud level above whenever it tried to rise, which led to the formation of three consecutive highs see on the chart. The price also received support from the 57.20 area whenever it tried to descend.
The situation remains as it is this week. Oil can be traded in quick deals depending on the cross area formed now on the 4-hour chart, as oil now provides a good selling opportunity with the price being below the cloud level and below the weekly pivot level.


Leave a Reply