Technical analysis in the foreign exchange market is based on the theory that market history, the movement of currency charts is constantly repeated, which means the repetition of events of the same type that have already occurred in the past. A pattern is a graphic drawing that makes it possible to predict the future movement of quotes. In this article we will analyze the most popular Forex patterns.
All templates can be divided into 2 main groups:
- Reversal;
- Continuation.
Judging by the names, the first patterns predict a cardinal reversal of the trend, the second group portends its continuation. A trend reversal portends a turning point in the movement of a trend and its subsequent cardinal reversal. The continuation pattern, in turn, simply portends a pause and subsequent trend movement in the same direction. The great advantage of this drawing is the ability to analyze the potential of the quote movement and the ability to close the order at breakeven when the order is not processed.
Table of Contents
Why Do People Use Forex Chart Patterns for Trading
Unlike trend trading systems, which rely on the continuation of price movement or counter-trend strategies that are looking for a pivot point, pattern trading does not always take into account pure price movement. That is, it doesn’t matter to us where the trend is, it’s important for us to identify tactical market situations (patterns) that we can unambiguously interpret and use for profit.
An example of Forex patterns are: combinations of Japanese candles, figures of classical technical analysis, and price formations from the Elliot theory. Strictly speaking, anything can be a pattern. In the context of patterns, the trader does not pay attention to global things (such as a trend, support and resistance levels, etc.). The main thing here is the search for tactical situations with quick entry and exit from the market.
The differences between timeframes and the style of trader
A timeframe is a certain time period on the Forex chart, during which various market data are combined. The most popular time frames among traders are the intervals: 5 minutes, 1 hour, 4 hours and 1 day. There are also more “older” timeframes – 1 week and 1 month. The choice of the timeframe size depends on the performance of the trader and his character. It is noted that more impulsive people show a desire to work on a 5-minute chart, where bars appear every 5 minutes.
More cold-blooded and phlegmatic traders are prone to measured and calm trading, which allows you to track information for analysis on hourly charts. Over-employed traders who have the ability to work on daily charts, as well as those who want to make “informed” decisions, being sure that the forecast is not based on short-term forecasts and haste, fall into a separate category.
There is a direct correlation between the level of profitability and the chosen time interval. So, the smaller it is, the lower the profit planned by the trader, based on each transaction. Meanwhile, a sufficient number of transactions on the “junior” timeframe made during the entire trading session can bring to a much higher level of earnings than when trading on the “older” time intervals.
What Chart Patterns are Used Most Often?
Many patterns do not work as they are written in books. The fact is that most Forex materials are taken from books 20-30 years old. Then there was a slightly different market. Most patterns do not work as described in classical literature. That is, it is necessary to compare the acquired knowledge with the current market situation. The theme of patterns is truly inexhaustible! Search for trading models provides almost unlimited opportunities in terms of successful trading. Let’s look at the most popular chart patterns.
Head and Shoulders
Head and Shoulders is a reversal pattern that justifies the moment when uptrends no longer show new highs and move to lows, changing the direction of the current trend.

Double Top Reversal
Double Top Reversal is a reversal pattern that is formed after double testing the resistance line and breaking through the support level. A double top is similar to the letter M. This model is often found on the market, and breaking through support is considered a sign of the need to enter the market with an order to sell foreign currency.

Double Bottom Reversal
The Double Bottom Reversal pattern appears when the value of a currency cannot overcome support and subsequently overcomes the level of resistance. To place a bet, we select the distance from the resistance level to the support level and put it off from the point of overcoming the lineup.

Triple Top Reversal
The Triple Top refers to the Head and Shoulders model, but while in the “Head and Shoulders” the middle of the graph is higher than other highs, then in this situation all the highs are at the same level. After the support line is over, a trader can enter the market with a currency sale transaction. Note that the triple peak is not observed often.

Pennant
Pennant is very similar to a symmetrical triangle, but is much faster formed on charts, and trend lines based on highs and lows converge sharply to each other. Pennant is always a figure of continuation of the trend, so traders should open orders only in this direction!

The Descending Triangle
The descending triangle is characterized by a lower border, which acts as support for the exchange rate, and an upper border, looking down. This graph indicates a downward trend and the prevalence of sellers over buyers in the market. After breaking through the bottom line, the chart gives a rapid falling movement.

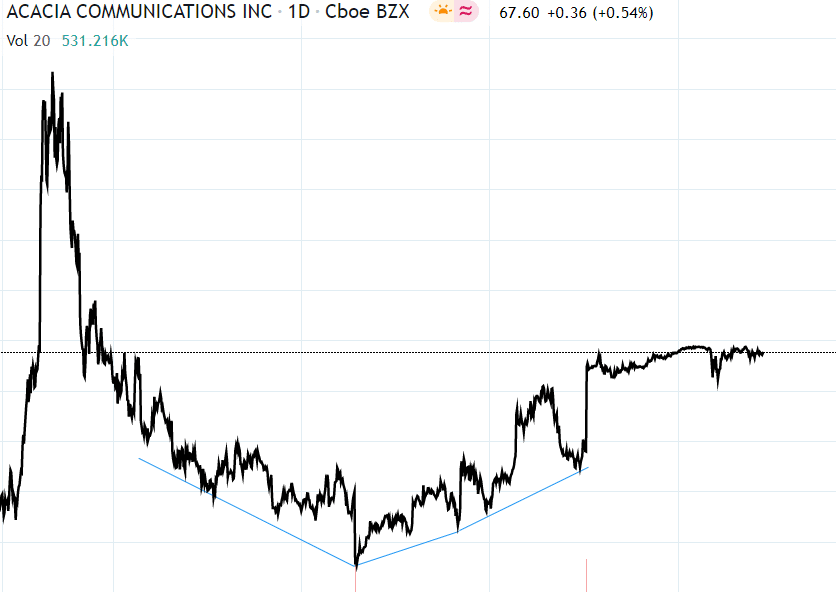
Rounded bottom
It is a chart pattern that forms after the price has moved lower for an extended period. The pattern is identified by the formation of a U-shaped pattern, as price slowly reverses from a downtrend to an uptrend. While the pattern forms in various time frames, it is deemed a rare occurrence in technical analysis.

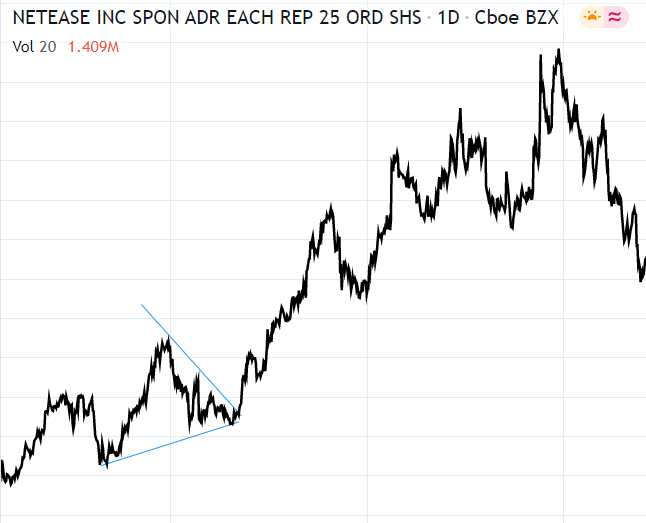
Wedge
A wedge is a powerful consolidation price pattern that forms when the price is bound between two rising or falling trend lines. A rising wedge is a bearish chart formation that indicates the price is likely to continue edging lower after consolidation. A falling wedge appears mostly in an uptrend signaling the likelihood of price resuming an uptrend after consolidation.

Cup and handle
Cup and handle is a longterm continuation chart pattern that precedes an uptrend. The pattern occurs when the price shows a slow mid-term decline with low volume and then begins to test old highs, forming a “cup”. After some selling pressure and consolidation, which forms the “handle”, prices are ready to go for the new highs on the volume.

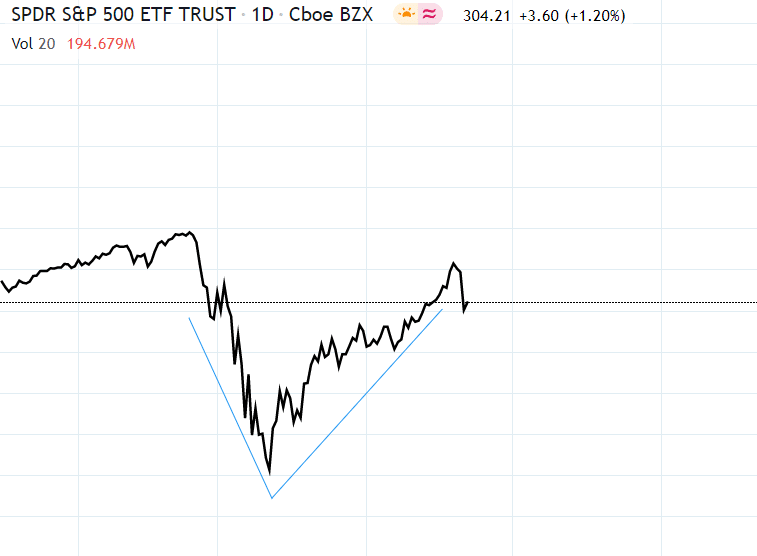
V-bottom
A V-bottom is a reversal chart pattern that occurs in a bearish trend affirming price reversal. The pattern occurs when price moves lower for an extended period before reversing sharply, conversely moving higher. The sharpness of the reversal leaves a V-Shaped trough in the chart. A single candlestick often forms the lowest point in a V-bottom, thus the sharpness of the reversal.

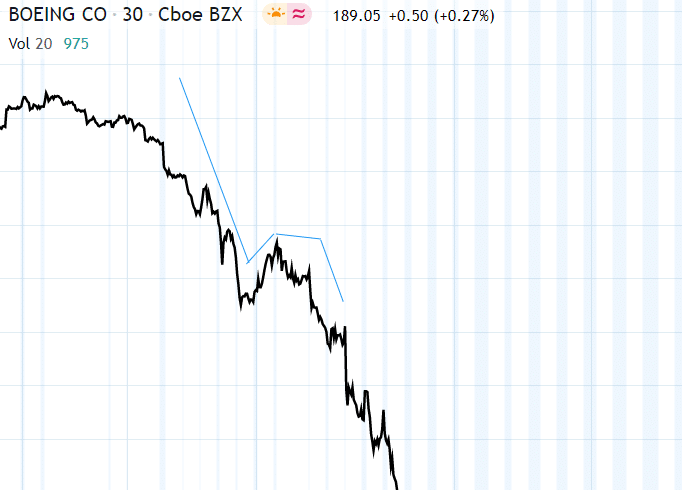
H-Pattern
H-Pattern is a chart pattern spotted in capital markets shaped like ‘h’. The chart pattern appears as a baseline with two peaks. The h-Pattern is a reliable bear trend continuation pattern that signals an underlying trend is going to push prices lower. The pattern forms when prices rebound after a significant down move. After that selling pressure begins to recover, sending a price to the new lows.

Final Words
Chart patterns are the basis of technical analysis in the foreign exchange market. In other words, when it comes to the past movement of the chart, its analysis to determine future trends and make hypotheses, we turn to patterns. The hypothesis put forward is based on observations of the graph and statistics on the movement of currency quotes in the past. All currently known patterns have been tested more than a thousand times by traders around the world, so they are completely safe and profitable to trade. The task of a novice trader is to learn to recognize and interpret patterns for successful orders.


Leave a Reply