
Breakouts are a common phenomenon in the forex markets. Active investors await breakouts as they provide an opportunity to profit within the trend’s early stages. Once price moves beyond a given barrier, i.e., range, volatility tends to increase, resulting in price moving with speed in the breakout direction.
A break out essentially occurs whenever price moves above a given resistance level marking the start of an uptrend after a long period in consolidation. Similarly, a breakout can occur whenever price breaks through a support level signaling the beginning of a downtrend on bears assuming control after a long consolidation period.
A breakout can occur at a horizontal level or a diagonal level on the price action.
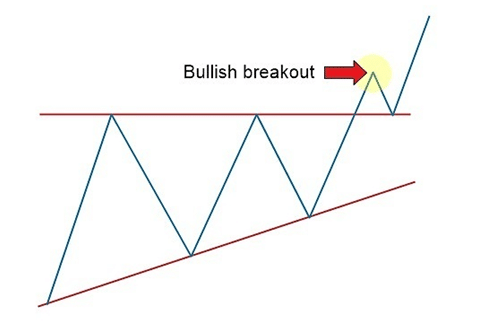
In the chart above, it is clear that price is trending up but in a defined channel consolidating between higher-lows and lower-highs. However, after some time, it breaks out of the upper channel signaling a bullish breakout.
When it comes to trading breakouts, it is essential first to identify the underlying trend. Once the trend is ascertained, it is essential to move forth and identify support and resistance levels to plan for possible entry and exit points in case of a breakout.
Breakouts occur in all types of market environments. However, the most explosive price movements occur in channel breakouts and price patterns involving triangles, flags, and head and shoulder patterns.
Types of Forex Breakout Strategies
ZigZag Swing Strategy
The ZigZag swing breakout strategy leverages the Zig-Zag indicator that is commonly used to determine price trends, support and resistance areas, and double tops and double bottoms. The indicator draws zigzagging lines on currency pairs making highs and lows of the price that act as immediate support and resistance levels.
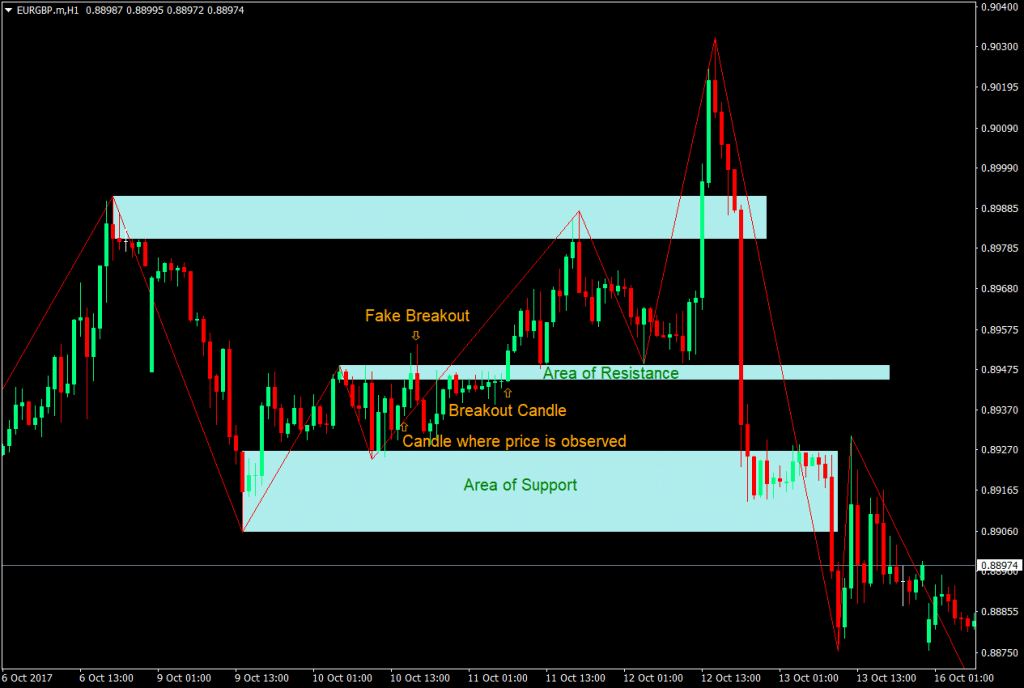
In the chart above, swing highs and lows act as support and resistance levels. Likewise, this is an area where price could bounce off or break through in what is often referred to as a breakout. In this case, it is essential to mark the highs and lows pointed out by the ZigZag indicator up to the candlestick’s body where the indicator is formed.
After marking areas of support and resistance level, look for areas where price could break out either on the upside or downside of the current price. Once price breaks and closes above-given support, wait for a confirmation candlestick, in the form a strong bear candlestick, to enter a short position as a way of riding the breakout to the downside.
Similarly, whenever price breaks a given resistance level followed by a confirmation candlestick in the form of a big bullish candlestick, be ready to enter a long position on the confirmation of an upside breakout.
Wicks formed by highs and lows of candlesticks should not be considered as entry signals.
A stop-loss can be placed just a few pips below the resistance level in a buy set up while in a cell setup, a stop loss can be placed a few pips above the support level.
ATR Momentum Breakout Strategy
The ATR momentum breakout strategy uses the ATR indicator, an indicator that measures volatility in the market. In the forex, market volatility is always changing, moving from highs to lows and vice versa. Likewise, periods of high volatility are synonymous with strong breakouts that allow traders to profit as prices breakout of support or resistance levels.
When it comes to the ATR Momentum Breakout Strategy, it is essential to:
- Wait For volatility to drop to lows depending on the time frame one is trading in.
- Identify the range during this period
- Trade the break of the range
Consider the chart below of Crude oil whereby after oscillating in a range for quite some time, volatility dropped to multi-year lows, as shown by the ATR indicator at the bottom.
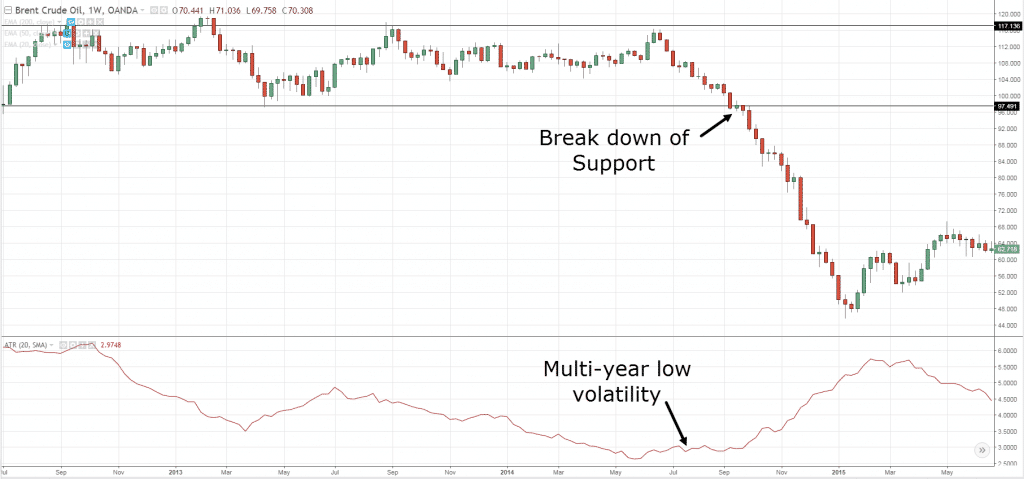
Once price broke through the line indicating support level it edged lower with velocity amid a spike in volatility signaling that bears had resumed control and planning to push the price lower. The price moved lower as the indicator moved higher, signaling a spike in volatility.
Similarly, consider the EUR/USD pair below, which had been trading in a range as volatility continued to edge lower.
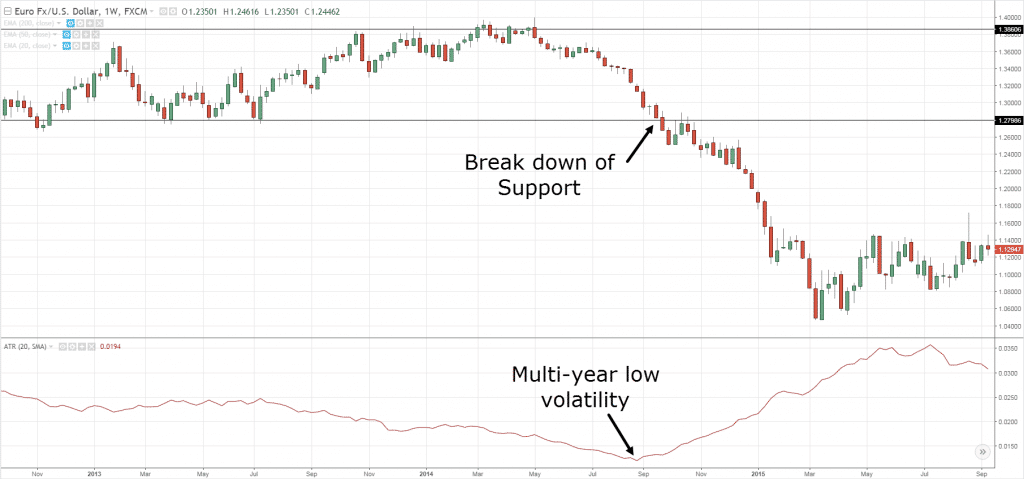
However, after some time, the price broke through the support level. Once it tried to bounce back into the range, bears came back and pushed the price lower as volatility increased as depicted by the ATR indicator signaling a bearish breakout.
Fisher Gator Reversal
The fisher Gator Reversal breakout strategy is designed to exploit rapid price changes after price moves in a given direction over an extended period. The indicator comes with three Indicators.
R-Gator
The R-Gator indicator is a momentum indicator that displays three moving averages. The shorter period is colored red, the medium colored green, and the long term colored blue. Price is said to be trending when the lines fan out.
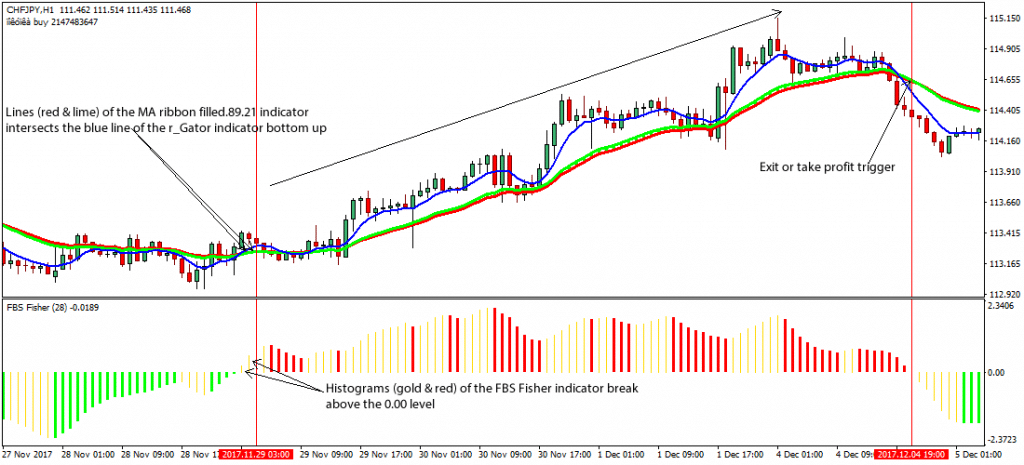
The MA Ribbon Filled
The MA Ribbon Filled is a trend indicator. It comprises a longer period and a shorter period moving average. The indicator occupies the space between the two moving averages to indicate trend direction. When the short term MA is above the long term MA the same signals a bullish trend and vice versa
FBS Fisher
The FBS Indicator is an oscillating indicator that signals trend direction and its strength. The indicator displays histogram bars. Positive bars signal bullish trend while negative bars represent bearish trends
How It Works
The Fisher Gator reversal breakout strategy takes into consideration how the three indicators converge to signal a reversal. First of all, it is essential to identify support and resistance levels in a chart. The indicator will then confirm the direction of the trend reversal.
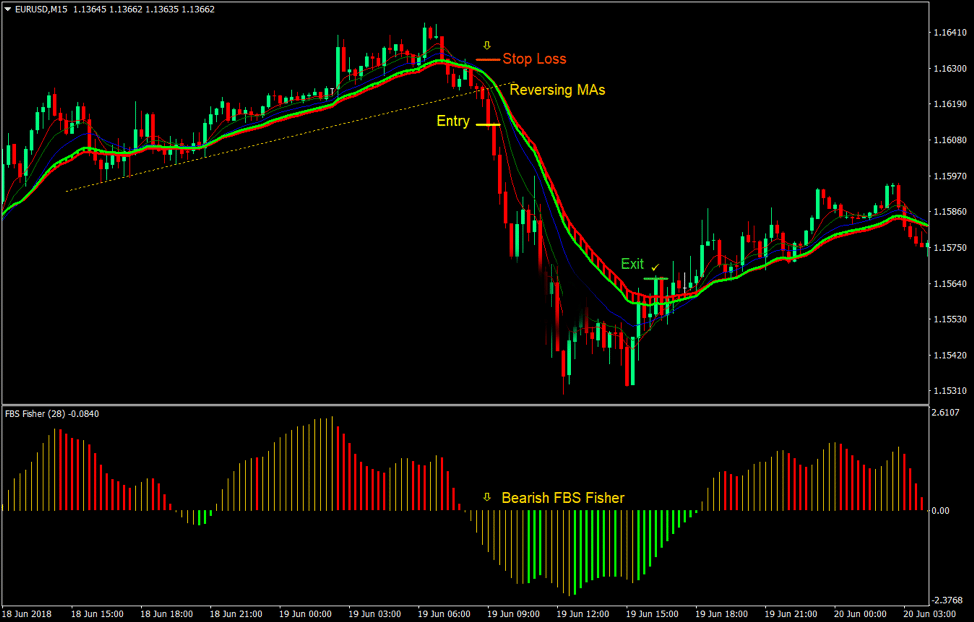
Trend reversal occurs when the R-Gator moving averages reverses and starts fanning out in the new trend direction. The MA Ribbon must follow suit and begin to crossover, indicating the mid-term trend is reversing. The FBS Fisher is used to affirm a reversal has occurred as well as its strength
Bottom Line
Breakouts are some of the best patterns to trade in the forex market as they usually signal the start of a new trend or continuation of the underlying trend. Once price breaks a given support or resistance level, it is essential to wait for a confirmation in a strong candlestick in the breakout direction. Similarly, the breakout should be followed by a considerable volume signaling it will hold and not reverse.


Leave a Reply