Forex Traders who use technical analysis as part of their trading method are already aware of the importance of technical indicators in the entire trading process. With a multitude of complicated and multipurpose indicators available, traders can get confused when choosing a set for their trading purposes.
Naturally, a common question encountered is: What are the best forex indicators that work?
The answer is complicated as it greatly depends on the trader’s nature, preferences and experience on the usage of different indicators. While there are no definitive “best”, there are certainly some indicators that have been found to have a demonstrable edge over others when used in forex market. This article aims to highlight three of them.
1. Average True Range Indicator:
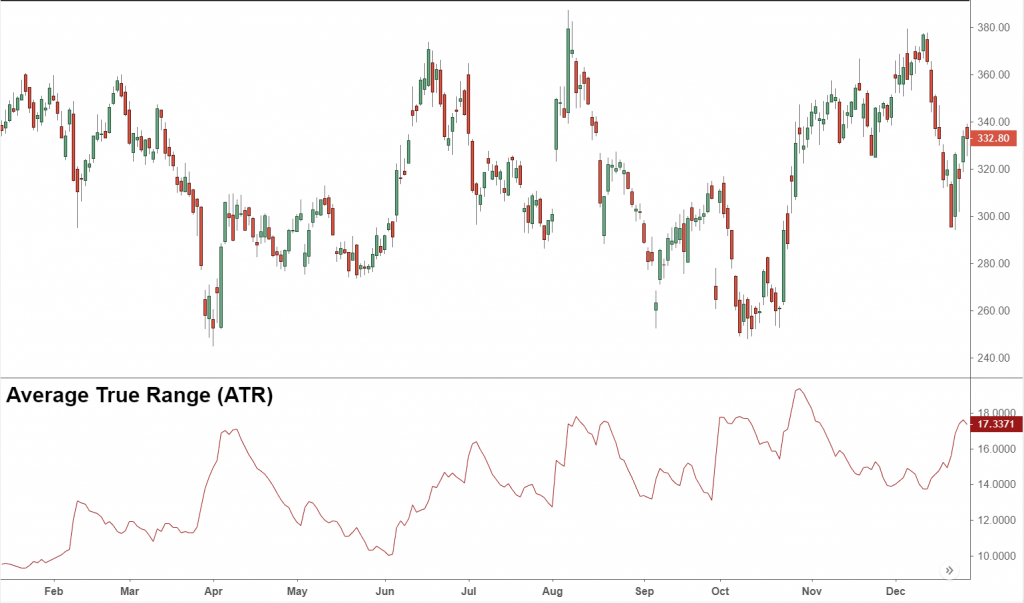
The Average True Range indicator or ATR is a technical indicator used to calculate the average range price of price candles, over any given period of time. Developed by famous market technical J. Welles Wilder Jr, the indicator is now used by many traders to optimize stop losses and target placements. The main purpose of the ATR indicator is to measure market volatility levels. Traders can learn to interpret the ATR to objectively determine the market volatility in a practical way, allowing them to adapt their trading strategies across multiple market conditions efficiently. The value of the ATR depends on the maximum result among the following three calculations: the current high subtracted by the current low; the absolute value of the current low subtracted by the previous close; and the absolute value of the current high subtracted by the previous close. The highest result among the three calculations is considered as the ATR for the given candle.

2. Relative Strength Index:
The Relative Strength Index or RSI as it’s commonly known as an oscillator indicator that emits values between a range of 0 and 100. Originally designed for stock trading, the RSI is now used for determining price momentum objectively.
Typically a high RSI indicates that many of the recent candles are bullish, just as a low RSI means that the recent candles are bearish. It is used a little differently in forex trading. The most effective way to use RSI is to spot momentum divergences in the forex market, especially on intraday trading timeframes. It is to be noted that the RSI is not a magical indicator but rather is used as a kind of filter. It is typically used to pick tops and bottoms, a difficult method for novice traders to follow.
The RSI is used to give the trade an objective indication of the magnitude of the current price momentum. As an oscillator indicator, it only expresses value between 0 and 100, with 100 and 0 representing extreme bearishness and bullishness respectively. Getting a reading of exactly 0 or 100 is extremely rare, which would mean that the recent price action has no hint of weakness and is entirely either bearish or bullish. The RSI value can be calculated as follows: RSI = 100-100/(1+RS), where RS equals to the average gain of the number of bars up divided by the average loss of the number of bars down.

3. Exponential Moving Average:
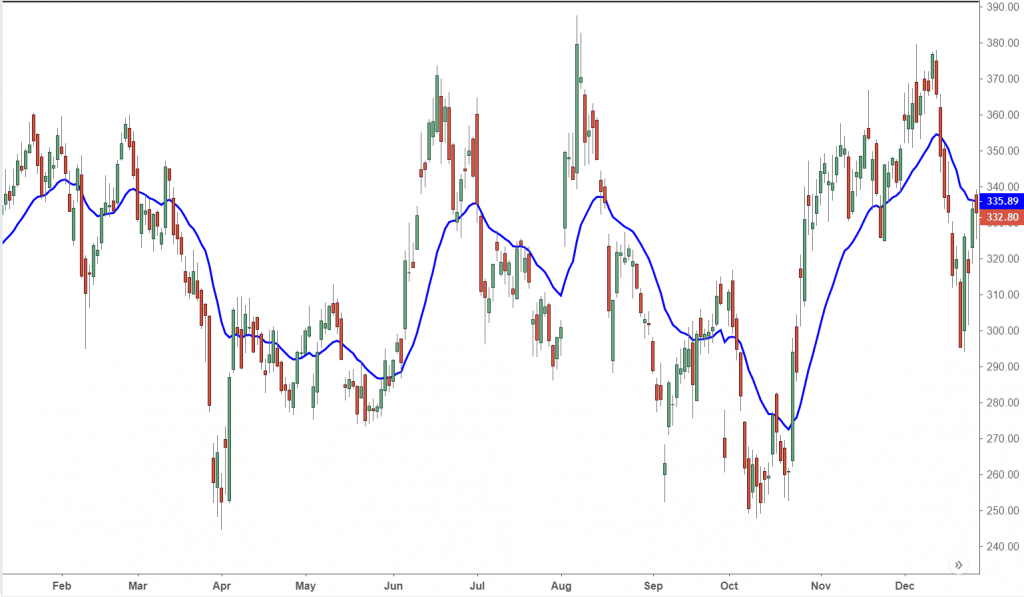
The exponential moving average or EMA is an indicator which falls under the category of moving averages alongside simple moving, smoothed moving, linear weighted and others. It works similar to the ATR indicator as it attempts to adapt to the market volatility. Traders choose the EMA over other moving averages because it gives priority to recent price action over old ones.
The EMA is commonly combined with price action principles, along with trends, structure and candlelight analysis to create objective trend- continuation strategy rules. Ti can thus be used to objectively define the trend. For instance, if the price level is above the EMA, the trader might look for longs and consequently look for shorts if the price falls below the EMA. The EMA can also act as either a dynamic resistance or support zone, which can be used to placing stop losses. The main edge that the EMA seems to have over other indicators is that it attaches even more weight to the most recent price data in an exponential fashion rather than in a linear fashion.
There are three steps involved in the EMA calculation. To calculate a 5 Period EMA, we first have to calculate the simple moving average. Next we calculate the multiplier, which in this case, is 2÷ (Number of periods, in this case 5) +1 = 2÷5+1=33.33%. This is followed by calculating the EMA= {Close – EMA (previous day)}* multiplier + EMA of the previous day.

The above three are just a few examples of some of the most used simple indicators used by many forex traders. As with almost all indicators, a large part of the trader’s success depends on how well they grasp the concept of a particular indicator and how they apply it. This requires a definite level of skill, experience, and technical know-how.


Leave a Reply