Fundamental analysis is an important practice when making trading and investing in cryptocurrencies, stocks, and other financial assets. It refers to the process of using external data to establish the intrinsic value of an asset. In stocks, investors look at multiple ratios like price-to-earnings (PE) and price-to-sales (PS).
In forex, they look at the economic calendar and news to determine whether to buy or sell a currency pair. In this article, we will look at some of the top cryptocurrency indicators to use for fundamental analysis.
Fear and greed index
The financial market is usually driven by the concept of fear and greed. When things are going on well, investors tend to buy more assets. This explains why most people were buying Bitcoin and other cryptocurrencies in the first half of 2021. At the time, these coins were rising, and making money in the industry was significantly easy. We also saw this euphoria during the dot com era in the late 1990s.
Fear is another important factor that tends to drive financial markets. The situation is usually manifested after a long period of greed, which leads to substantial gains. As the price starts dropping, greed leads to a substantial sell-off.
Fear also happens when investors anticipate that more sell-off will happen. For example, in early 2022, the price of most cryptocurrencies dropped because of the fear of a hawkish Federal Reserve.
Therefore, the fear and greed index is an important indicator that guides investors about market sentiment. The most common fear and greed index were developed by CNN Money. It is made up of an aggregate of several indexes in the market like safe-haven demand, CBOE volatility index, stock price breadth, stock price strength, and market momentum.
A Bitcoin-focused fear and greed index has also been developed. It is similar to the one created by CNN Money in that it looks at several sub-indexes like volatility, market momentum, social media, dominance, and trends.
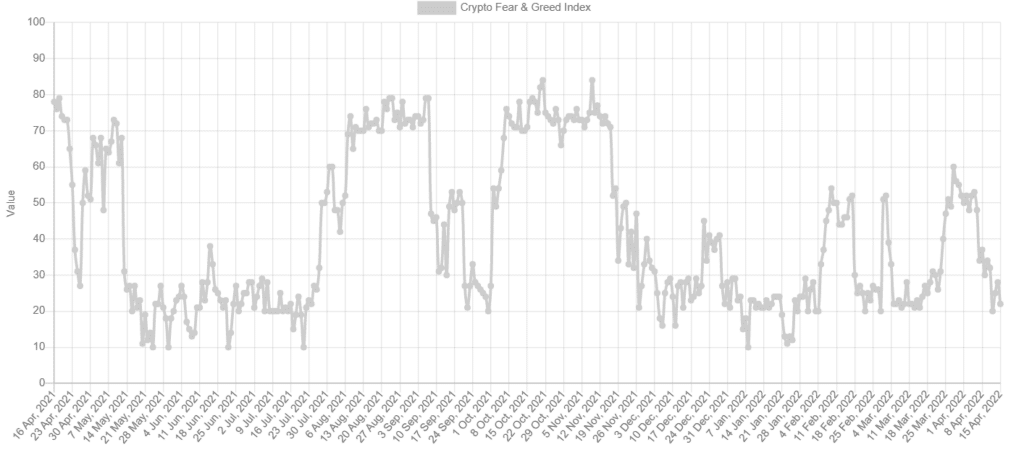
The index ranges between zero and 100. Zero represents extreme fear, while 100 represents extreme greed. Sell signals emerge when it crosses the neutral point at 50, moving downwards, while buy signals come out when it crosses the 50 level. A buy signal also comes out when it moves to extreme fear and vice versa.
Bitcoin dominance
Bitcoin is the biggest cryptocurrency in the world, with a market cap of about $763 billion at the time of writing. This is a substantial figure considering that all digital coins tracked by CoinGecko have a market cap of over $1.97 trillion. The website tracks over 13,000 coins.
Bitcoin dominance is defined as the proportion of Bitcoin compared with other cryptocurrencies. In this case, these numbers put Bitcoin dominance at 38.7%. As shown below, TradingView shows a different dominance because it considers more digital coins. In its case, the dominance stands at about 41%.
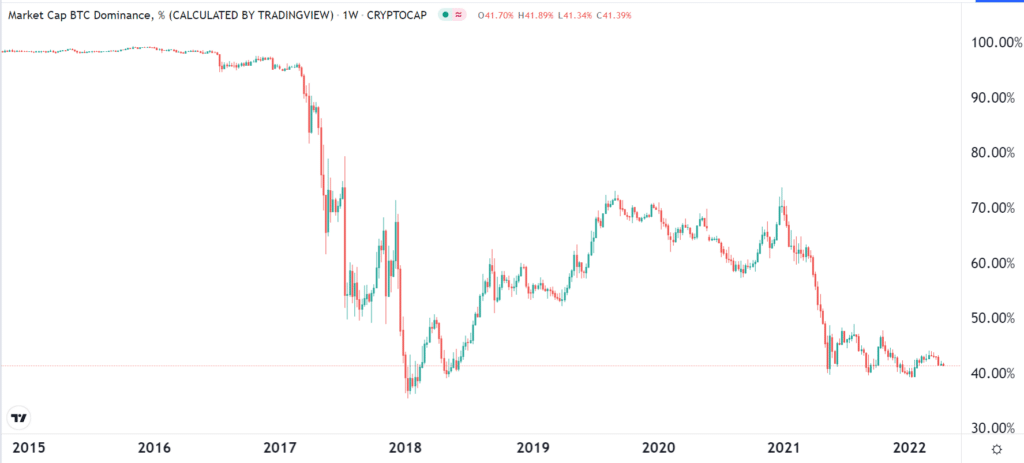
In the past, Bitcoin had a bigger dominance because the number of altcoins was few. Also, many investors were afraid about allocating money to these coins. As a result, the dominance figure has dropped from about 100% in 2015 to the current 41%. This is a sign that the number and volume of altcoins have been growing.
Investors use the Bitcoin dominance chart to measure the performance of both BTC and other altcoins. In most cases, when the figure rises, it is usually a sign that investors are losing confidence in altcoins and moving to Bitcoin and vice versa.
However, the dominance chart has historically been a bad indicator of what to buy or sell in the cryptocurrency industry. At times, the dominance can decline even when the Bitcoin price is rising.
Whale holdings
Another popular fundamental tool for cryptocurrency analysis is that of whale accumulation. A whale in the cryptocurrency industry is defined as an entity or individual who holds a substantial amount of coins. An example of a whale in Bitcoin is MicroStrategy, a company that owns Bitcoin worth over $6 billion.
Whales in most altcoins are usually seen as insiders because of the coins that they allocated to themselves during the creation process.
A good thing about the cryptocurrency industry is how easy it is to see trends among holders. This happens because the activity of these coins is usually made in the open. However, analyzing this raw data can be a difficult process, which is why many people use external data providers like Glassnode and Cryptoquant.
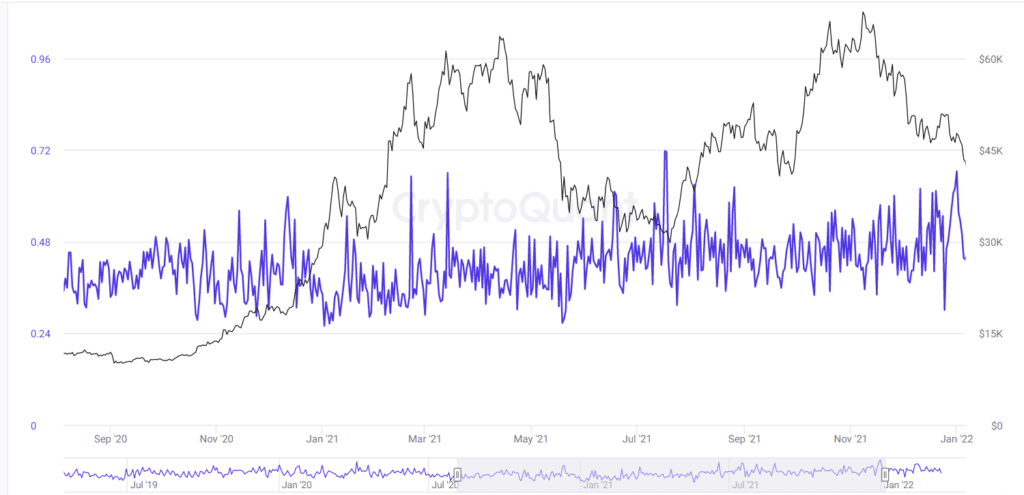
In most cases, a sharp increase in whale holdings is usually seen as a positive thing. However, the indicator is also not all that reliable when buying and selling cryptocurrencies. The chart above shows the relationship between Bitcoin prices and whales.
Exchange inflows and outflows
Another fundamental data useful when buying and selling cryptocurrencies is exchange inflows and outflows. Ideally, investors use data to determine whether investors are buying or selling cryptocurrencies.
When inflows to exchanges are high, investors move to exchanges and allocate funds to coins. On the other hand, outflows are usually a sign that they are giving up on the sector and selling their coins.
One can use data provided by companies like Glassnode and IntoThe Block to see whether there are strong inflows in the sector.
Another data that is also important is inflows and outflows in funds. Examples of these funds are the Bitcoin Futures ETF and the Grayscale Fund. Inflows into these funds are usually a positive thing for digital currencies.
Summary
Fundamental indicators are useful tools for trading cryptocurrencies and other assets. In this article, we have looked at some of the most useful tools to use when deciding whether to buy and sell digital currencies. Other useful indicators are social media mentions, on-chain volume, and realized price by age.


Leave a Reply