Reversals are common in the market whenever financial instruments move in one direction for a prolonged period. Double tops and bottoms, head and shoulders, and engulfing candlestick are commonly used configurations to predict potential exhaustion points. However, they are not the only ones.
Bearish diamond top
It’s a less talked about reversal pattern that occurs whenever financial instruments move up for a considerable amount of time. It occurs at the top of uptrends, hinting at exhaustion and potential retracements lower. Additionally, it mostly occurs in liquid financial instruments where gaps are a rare occurrence. While it can manifest itself in any time frame, it is mostly identified in hourly and daily charts.
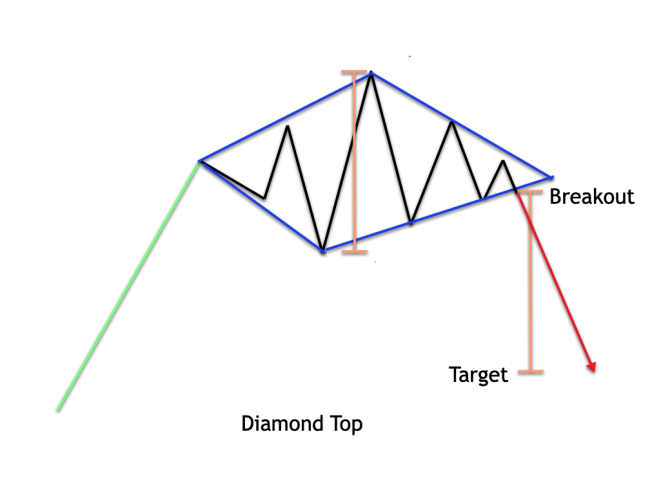
The pattern forms at the end of an uptrend after a prolonged period. It is characterized by a diamond-like structure on the drawing of support and resistance levels.
The pattern is usually confused with the head and shoulders configuration resulting in people triggering short positions prematurely.
However, it differs a lot as it occurs before the head and shoulders shape. While it also shares the same attributes as double tops and bottoms, its lack of distinctive ups and downs is its main differentiator.
Requirements
- The financial instrument under study should be in an uptrend
- Consolidation within a tight range of the diamond configuration should come into play
- It comes about on connecting peaks and troughs

After the market hits a strong resistance level, exhaustion often creeps in as buyers exit and sellers start to cycle. The outline starts to form as an instrument retraces from the new high. However, after a small pullback, bulls often come into play, fuelling asset value to a new high from the previous point where correction started.
After the price hits a new high from the correction, it often corrects below the previous swing low, resulting in a new swing to the downside. An instrument may struggle to rise above the last swing, settling below the last high upon a new correction.

It connects all the fairly sized swings on the upside and downside results in a diamond-shaped appearance from where the configuration gets its name Bearish Diamond Configuration. Rejection from the new all-time highs characterized by a new low warns of a potential breakout to the downside.
In most cases, it is assumed that security values will always face strong resistance to the upside and support to the downside within the diamond outline. As long as an instrument holds within the support and resistance levels, it is considered to be in consolidation.
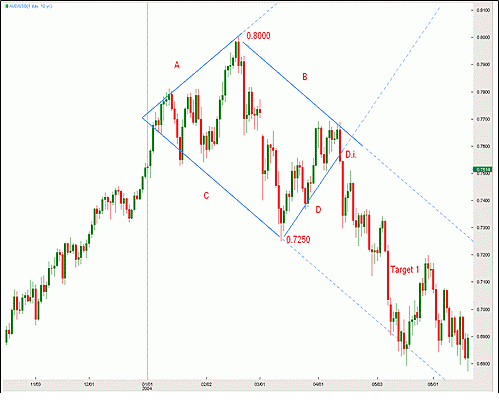
As soon as an instrument closes below or up the configuration, as if to warn of a breakout, it is important to wait for confirmation. For instance, if an instrument was to break below the lower support lines, a confirmation in the form of a bearish candlestick will have to come into play to trigger a breakout.
Once security closes below the sustenance line, it hints that sellers are in control with selling momentum building up and likely to push to new lows.
Traders looking to profit from the arrangement can enter a short position as soon as an asset under study breaks out after consolidation. When dealing with liquid currency pairs, the breakout from the diamond top configuration tends to be strong and fluid.

While looking to enter a short position to profit from the configuration, it is important to wait for a breakout below the support line. A bearish confirmation candlestick like the one above would affirm that bears are in control and momentum is the downside.
Money management will also have to come into play as a bounce-back is always possible, even on breaking the support level.
In this case, a stop-loss order can be placed slightly above where the support level was broken to minimize any losses that might occur on a reversal.

The profit target for the short position would be anywhere close to where the uptrend started. However, in most cases, one can measure the width between the highest level in the consolidation and the lowest point and extrapolate it from where the breakout low starts. The width size will, in this case, act as the measure of the profit take point to the downside.
Using oscillators
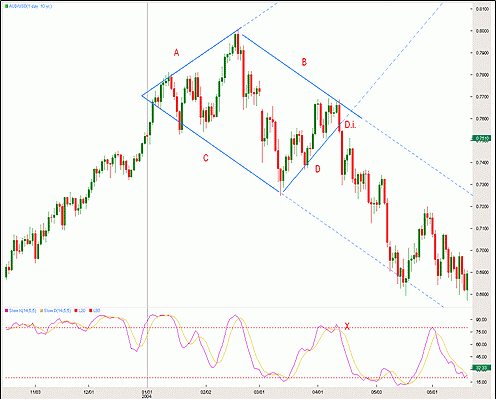
To increase the prospects of accurately predicting a reversal, trade the bearish pattern with other indicators. You can use oscillator indicators such as the Relative Strength Index or Stochastic to increase the accuracy of the trade by motioning potential points of rejection.

In the chart above, the use of the Stochastic indicator accurately predicts the market is overbought at the peak. Likewise, as shown in point X, the crossover of the indicator gestures, building selling pressure likely to fuel to the downside.
Bottom line
The bearish diamond top outline is a rare technical analysis pattern used to warn of a reversal from an uptrend. It forms as a diamond but with four corners as if to indicate sideways movement within the support and resistance levels until a breakout to the downside occurs.
It is much easier to identify the reversal outline in Forex, given the increased liquidity of the market.
In contrast, it is difficult to determine the pattern in the equity market given the gaps in price action that come into play. Gaps in the equity markets displace some of the points needed to draw the diamond top accurately.


Leave a Reply