The average true range (ATR) is a tool that is used to measure volatility, and it shows how much an asset’s price fluctuates on average over a given period of time. As a confirmation tool for both entry and stop-loss orders, this indicator is useful for day traders.
It is important to note that the ATR does not reflect the price trend of the market; rather, it concentrates on the market’s volatility.
Calculating ATR
Identifying the True Range is a prerequisite to computing the ATR. Taking into account the most recent high/low range and the previous close (where necessary), we arrive at the True Range.
True Range = max[(high – low), abs(high – previous close), abs (low – previous close)
Because ATR solely measures volatility, we use absolute values and ignore negative figures.
Average True Range = (Previous ATR X (n – 1) + TR) / n
Where:
n= number of Periods
TR= True range
How it works
This indicator measures price fluctuations by looking at the differences between the highs and lows that have occurred in the current candle. The same principle applies to the comparison between the current candle and previous candles’ lows and highs.
Other key guidelines include:
- Each bar’s range expands as the ATR rises; this suggests that the market is becoming more volatile. When prices reverse and the ATR increases, this indicates that the movement has strong momentum. The fact that the indicator is non-directional means that a rising reading could indicate selling or buying pressure. There is a good chance that high ATR values are the result of a short-term spike or dip in the price of an asset.
- Small ranges can be seen in times with a low ATR. Low values are common over long periods of sideways price movement, which explains the reduced level of volatility. Consolidation and a possible reversal are likely when ATR readings remain low for an extended length of time.
- As volatility changes, the Average True Range can be a helpful stop or entry cue. In contrast, to set dollar-point or percentage stops, the ATR stop is flexible enough to adjust to price fluctuations, which could lead to an extreme price movement.
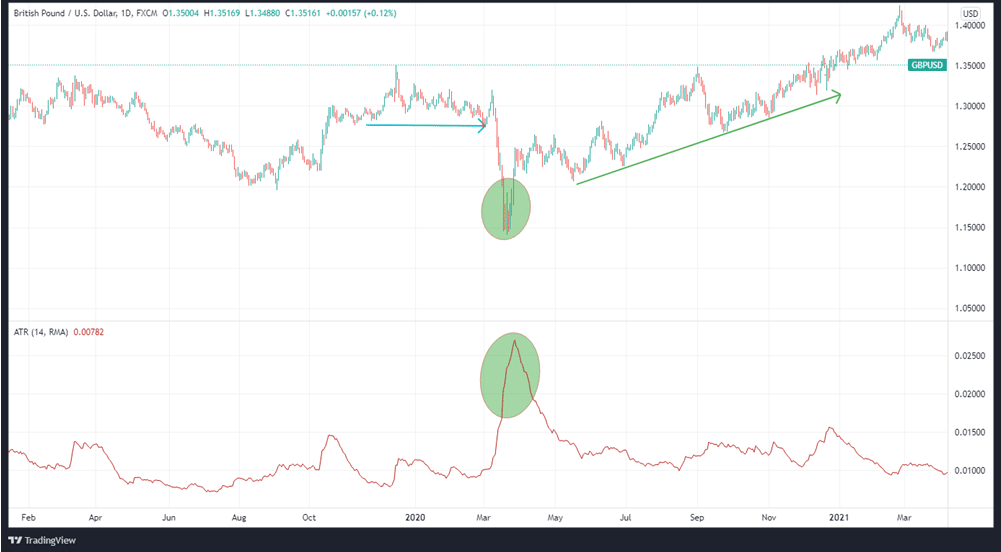
It appears that the GBPUSD price in the chart above is in a mild downtrend, as shown by the low ATR value. The price range expands rapidly over a short time period, followed by a sudden spike in volatility. The indicator’s reading is steadily increasing. After that, a gradual upward movement starts.
The indicator reading is decreasing, despite the fact that the distance between the beginning and the end of the trend is much greater than the volatile segment’s range.
Using the ATR as a trading tool
With the help of the indicator, traders may place buy and sell orders, set stop losses and profit targets. When it comes to making trading decisions, the Average True Range trading method can be a big aid.
The most popular application of the Average True Range is as a stop-loss tool. There is increased volatility and broader price variations when the ATR is high. To prevent being knocked out of the trade early, they would position their stop-loss orders further away. Conversely, if the indicator shows reduced volatility, traders may utilize a closer stop-loss order.
It is also helpful to look at the profit potential of trades using the Average True Range. In a market with low volatility, you can set a closer stop loss and move it further away if volatility rises.
Forex trading with ATR indicator strategies
Stop losses
Traders who initiate or close a trade at the wrong time can suffer enormous losses in the forex market. Stop-loss and limit order placement can be more accurately determined by utilizing the Average True Range in a trading strategy. If the currency pair’s ATR is high, traders should utilize a larger stop-loss order.
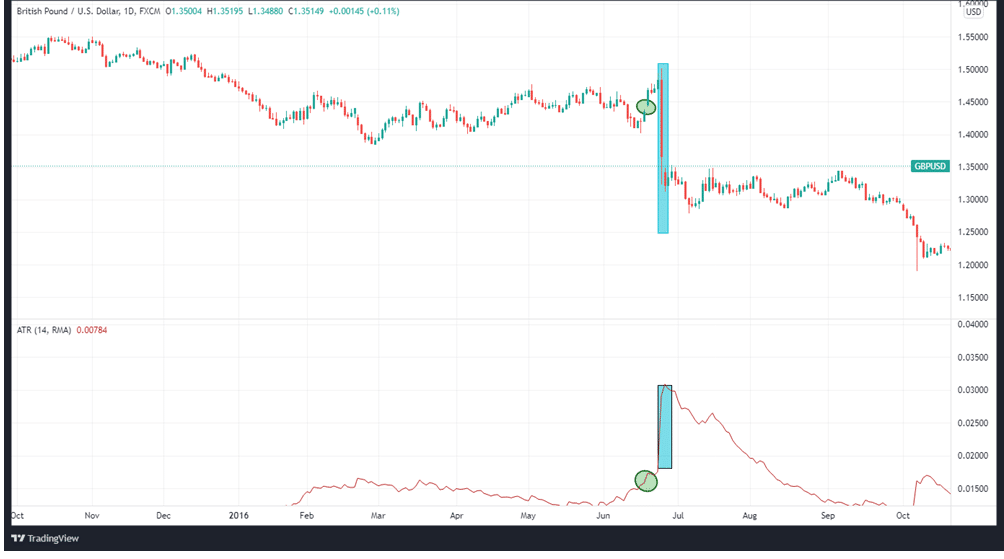
In the example above, the ATR indicator for GBPUSD surges quickly upwards whenever there is a rise in market volatility. When a price gap occurs, the line is at a low point as the price volatility rises.
Alerts based on ATR breakouts
An additional way to spot possible breakouts is by examining the ATR. Try to keep an eye on its value and a multi-year low. After finding a support level, look for the breakout price, which indicates that volatility will grow and a breakout may occur.
In order to determine the best times to enter and exit a position, traders might make use of the ATR formula. You can take advantage of moments of low or high volatility by remembering that they will end. As an example, traders may anticipate an uptick in volatility following a period of low volatility, and this could be a good time to enter or exit your position.
Trailing stop loss
The ATR can be used to locate suitable stop-loss or trailing stop-loss order placement points. This indicator helps eliminate the option of placing a small stop-loss order during periods of high volatility or a very wide stop-loss order when the volatility is low. You can see how you can use the indicator as a stop-loss order in the chart below.
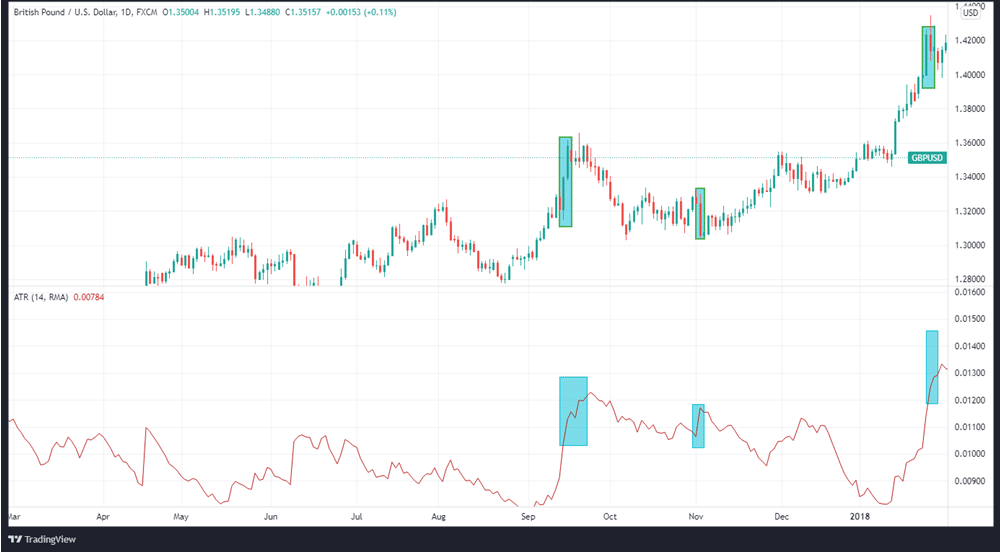
In the chart above, price fluctuations during periods of increased volatility are indicated by blue rectangles, which indicate increased volatility as shown by the green rectangles. Trailing stop loss decisions should use the ATR to guarantee that the profit is locked in and that you do not define a narrow stop loss that can potentially lead you to exit the market prematurely.
Stop-loss orders can be used to protect your earnings when the market is less volatile or heading sideways. Using the ATR as a starting point for your trailing stop might be advantageous because your stop loss will shift with the volatility, making it easier to manage your risk. It is also possible to activate the stop loss depending on the indicator’s value if price action is not in your favor.
In summary
The Average True Range measures volatility over a specific period of time. A higher number indicates a more volatile market, while a lower reading indicates that the price movements of an asset are becoming less dramatic and, therefore, the ATR value rises or falls in tandem. In addition, stop and limit orders, as well as opening and closing trades, can all be determined using the indicator.


Leave a Reply