
Forex consists of a diverse trading community where we find defined camps of traders who religiously subscribe to particular market beliefs and trading methodologies. For instance, more and more traders are adopting price action concepts, even though not everyone agrees with them.
Other parts of the community may be die-hard proponents of moving averages and use that as their primary method of trading the markets. Supply and demand is another interesting trading idea with its legion of both practitioners and naysayers.
Regardless, its existence is evident on the charts and, like any approach, follows a specific blueprint to yield the best possible results. This article will explore more about supply and demand trading and ideas best complimenting this method.
What is supply and demand trading?
Supply and demand trading is a methodology in forex attempting to pinpoint areas on the chart where price has previously made an impulse up or down and mark these places as zones. We’ll refer to supply & demand as S & D for convenience.
The belief is should the market return to such levels soon, it will likely produce the same kind of move as before because of the supply and demand law.
In economics, when the supply for a product is low and the demand is high, prices will typically rise; when the demand is low, but the supply is high, prices will likely fall. Proponents of S&D look for these zones constantly.
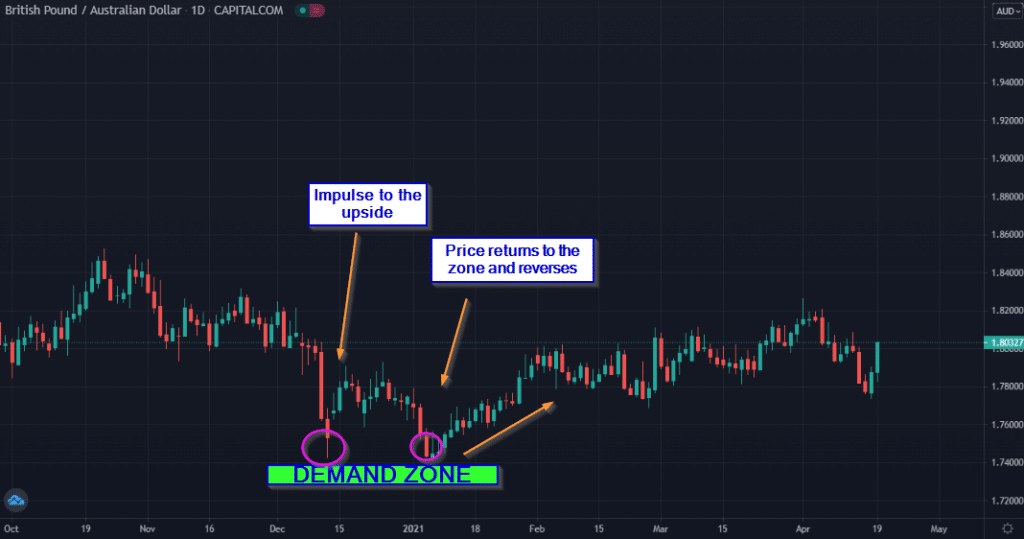
Where the price has previously shown an impulse to the upside, this represents a demand zone and an area of buying interest.
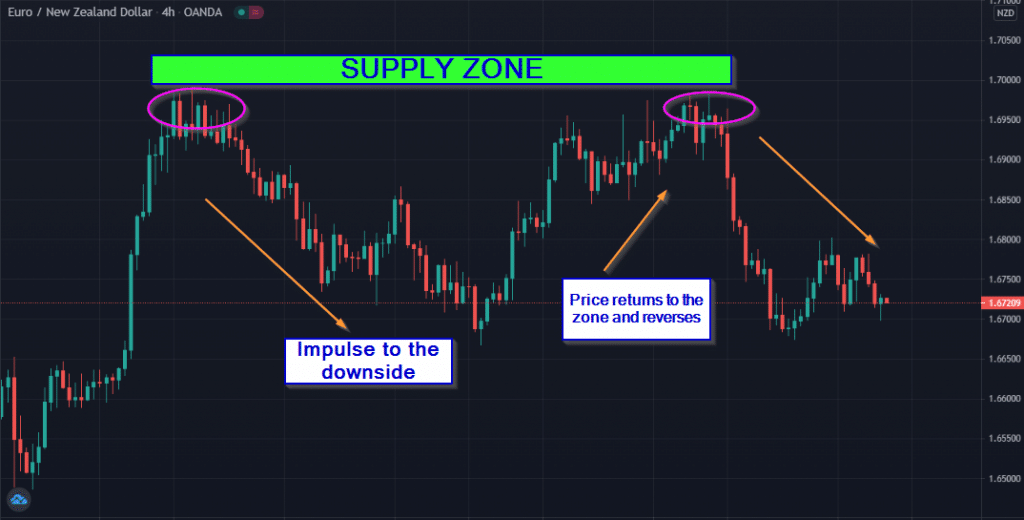
Conversely, where price has advanced strongly to the downside, this shows a supply zone, an area of selling interest.
The popularity of S&D is often credited to legendary American trader Sam Seiden, sometimes even referred to as the developer or pioneer of the strategy. S&D is a somewhat unconventional method of analyzing the markets, and we could consider it to be a form of reversal trading.
Therefore, it’s safe to assume S&D is a trading strategy suited only to the experienced.
Similarities with support and resistance
We could presume S&D is just a fancier version of trading support and resistance (S&R). Whether a trader is conscious of it or not, they will use some S&R in their trading decisions. As traders, it’s hard to consistently know whether the market will truly respect a defined level or not.
Although S&R is similar to supply and demand, one of the two big differences is S&R typically refers to specific prices, whereas supply and demand refer to zones.
Both approaches look towards areas where there previously were large declines and inclines, except that with supply & demand, traders call these zones and will then look for other evidence another big move may be on the cards.
The second distinction has to do with studying order flow in the zones themselves. Those who find consistent success with S&D have to do some form of fundamental analysis. For instance, many S&D traders will look towards observing institutional positioning through various methods.
It’s not to say all traders religiously using S&R perform some similar external research. However, supply and demand can better explain why price moved the way it did because of their superior understanding of order flow.
They should look for other things behind the moves aside from technical analysis.
Combining S&D with other analysis
Like any approach, its effectiveness is better when combined with something else. This is especially crucial in S&D because, for the most part, it deals with reversals. Trading reversals in forex is challenging, but one is likely to be successful by looking beyond the charts.
As briefly mentioned previously, having a deep understanding of order flow is crucial in S&D. The first step is always drawing the zones accurately on the charts. Although there are a few interpretations of how to do this, a few indicators exist aiding traders in this regard.
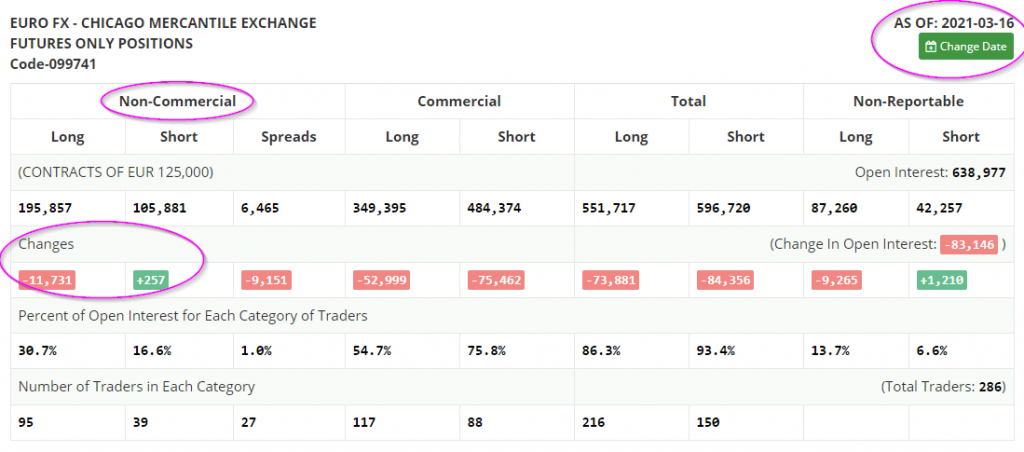
After establishing the zone itself, the next step is using other analyses. One method is using the Commitment of Traders (COT) report and only observing the number of buy and sell positions the non-commercial section has added or removed.
An example of a supply and demand trade using the COT
Although the COT is from the futures forex market, the positions correlate with spot forex. It is one of the few methods for detecting institutional positioning, which is naturally almost impossible within a decentralized market structure like currencies.
The non-commercial section consists of large financial institutions and retail investors, all of whom are speculative traders. In the image below, we see non-commercial traders added 257 sell orders and removed a staggering 11731 buy positions on 16/03/2021, a big sign of selling pressure in this zone.
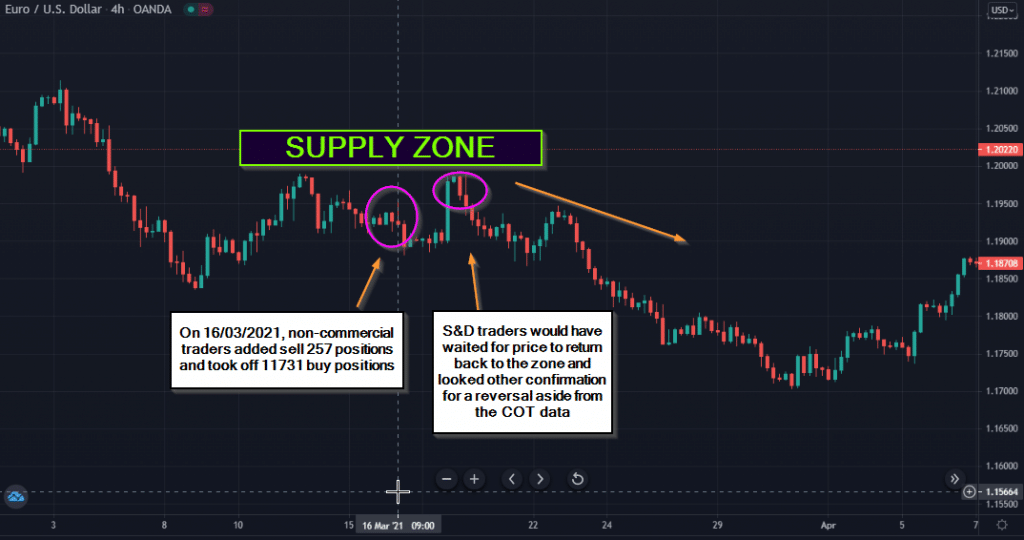
Two days prior, traders would have witnessed a supply zone on EUR/USD because of the minor decline around the first purple ellipses from the left. A supply zone forms after a price decline, at which point traders wait for the market to get back to it.
Using the COT data that suggested increased selling pressure, when the price did return to the area marked on the image, we see a strong move to the downside. Of course, a wise trader wouldn’t only execute based on one confirmation factor, but S&D will have formed the foundation of the entire trading idea.
Final word
Needless to say, this entire article is only an introduction scratching the surface of supply & demand trading.
There are other deep and crucial concepts traders should explore, such as what forms a zone in the first place, what makes it stronger than others, how price action plays a role in increasing the likelihood of a reversal, and so on.
Nonetheless, this trading approach is for the experienced trader. When used correctly, it can offer traders set-ups with highly favorable rewards.


Leave a Reply