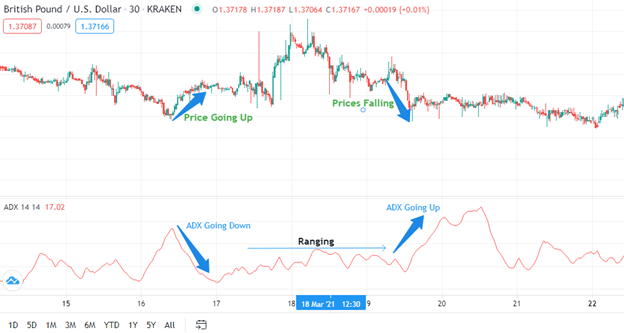
Average Directional Movement Index (ADX) is a widely-used indicator that is often employed to measure how strong a market trend is. However, ADX is not used to determine whether a market has assumed a bullish or a bearish trend. It is used to assess the strength of a trend using the average expansion in price range values.
How does ADX work?
ADX determines the strength of momentum by incorporating Directional Movement Index (DMI) as employed in the positive direction (DI+) or negative direction (DI-). ADX is obtained by working the average value of the DX over a specified period. Using these indices, traders can determine whether to buy or sell based on the strength of a trend.
The ADX scale ranges from 0 to 100. It is built on the premise that the strength of momentum is just as important as the direction of the price. A lull ADX refers to a situation where the price is either ranging or trading sideways. Readings above 50 indicate a strong trend, while those below 20 are interpreted as a weak trend.
Tips for working with ADX
There is a direct correlation between the value of ADX and the slope of a trend. Therefore, when using ADX, keep the following in mind:
- A weakening ADX indicates that the current trend is about to change; therefore, you should consider trading in an opposite direction when dealing with such a trend. However, this may not always be true 100% of the time. Remember that an ADX reading above 25 is still strong enough to sustain a trend with marginal changes in price. You should therefore check a weakening ADX trend against price changes.
- A rising ADX indicates that the market is strengthening. The gradient of the ADX line is a direct indicator of the margin of change in price movement.
- If the ADX line goes below 20, then that’s an indication that there is no trend being established.
Strategic use of ADX
The principal reason for using any indicator is to tell a trader what the price alone cannot tell. ADX indicates the impact of prices on the momentum of buyers and sellers in the market. It follows, therefore, that a trader should be keen on indications of breakouts from established trends before deciding whether to buy or sell.
Breakouts herald changes in demand and supply forces. This is because breakouts send the clearest signal that there’s about to be a significant disagreement between buyers and sellers as to the right price to sell. Traders should therefore use breakouts to make informed decisions as to whether to buy or sell.
ADX is useful in verifying the validity of a breakout since it shows just how strong the current trend is. ADX can therefore be used to gauge the likelihood that a given price will trend. A rise in ADX past 25 from below the mark is a strong signal that the price will continue in that established direction.
The ADX indicator, even when read alongside the prevailing price movement, can only be used to establish whether a trend is strong or weak. It cannot be used, on its own, to establish whether a market is becoming bullish or bearish. For example, when the price trend is moving upwards, and there’s corresponding upward mobility by the ADX line, the market is said to be bullish. However, when the price is moving downwards, and the ADX is on the upward trend, it signals a bearish trend.

Combining ADX and RSI
As mentioned above, the ADX indicator should ideally be used in combination with other technical indicators. One of the best indicators to use alongside the ADX is the Relative Strength Index (RSI). When used together, the two will complement each other since the ADX will indicate the momentum of price action while the RSI will signal when to enter the market to buy or sell a stock. Typically, traders use the default 14 periods, although it can be adjusted to any other period.
The RSI sends an oversold signal when it goes beyond 30 and indicates that security has been overbought when it goes beyond 70. A bullish divergence is indicated when the price moves higher, and the RSI moves upwards. Conversely, the market is said to be bearish when the price moves higher, and the RSI moves downwards.
Here are pointers on how to trade with ADX and RSI combination:
1. When using the price action in combination with the ADX. The price action will let you know the direction of the trend, while an ADX movement above 25 will let you know that the momentum is strong enough to buy a stock.
2. Is the ADX below 25? Then it’s time to take the profit! When the RSI and ADX combination shows signs of a weakening trend, it’s time to pick up the profit because that is a sign of an impending breakout in price.
3. When using the ADX in combination with RSI, sell when the RSI goes below 30. An RSI below 30 indicates that the stock has been oversold and sends an entry signal for you to buy.4. Always have a protective loss stop. The ADX last high should be the point at which you place your protective stop loss.


Leave a Reply