A break and retest strategy is a popular approach by traders and investors focusing on price action. It involves waiting for a breakout to happen and then being patient for it to retest the immediate resistance/support level. This article will look at what a breakout is and how you can use the break and retest strategy in forex.
What is the break and retest strategy?
Currency pairs and other assets move in several patterns like upward and downward trends. They also form consolidation patterns at times.
As they do this, currency pairs tend to form different patterns that are popular among price action traders. We will look at some of these patterns in the next section.
Still, the most important concept in price action is about support and resistance. Support is a price where a currency pair’s price struggles to move below, while resistance is where it struggles to move above.
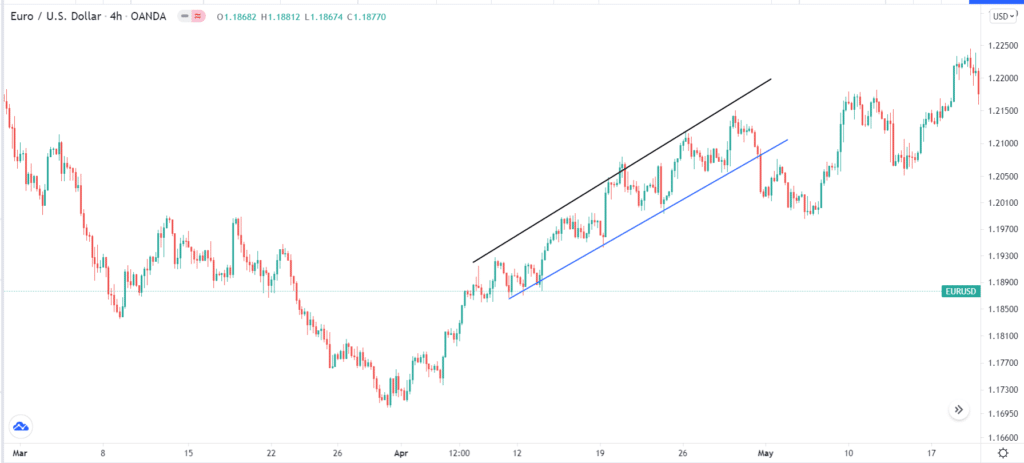
For example, it is common for a currency pair to struggle to move below a psychological level like 1.1200 or 1.1100. It is also common for the pair to struggle moving above a psychological level like 1.100. The chart below shows support (blue) and resistance (black) on the EUR/USD pair.
Support and resistance levels

Therefore, a break and retest is a situation that happens immediately when a currency pair moves above a key resistance or below a key level of support. The idea is that, in some cases, the price will retest the support and resistance level after it breaks out. This retest is then used as a good entry point for bulls in case of a bullish breakout.
Price action patterns
The break and retest strategy is usually ideal for traders using the price action strategy. These traders typically look at several chart patterns to know whether to buy or short a currency pair. Some of the most popular chart patterns are:
- Rectangle – A rectangle pattern is also known as a parallel channel because it is made up of straight support and resistance levels.
- Triangle – This pattern resembles a triangle with three sides. The three common types of triangle patterns in the forex are symmetrical, ascending, and descending triangle patterns. The latter two patterns are usually a sign of trend continuation.
- Bullish and bearish flags and pennants – A flag pattern happens after a major up or downswing. The flag is made up of a rectangle, while a pennant is made up of a triangle-like pattern.
- Head and shoulders – This is a popular reversal pattern that happens after a major rally. It typically results in a new bearish trend.
- Cup and handle – This is a pattern that resembles a cup and handle. The deepest and the longest price swing is a cup, with a handle being a smaller price swing that precedes a breakout and subsequent trend reversal. It mostly happens over an extended period of time.
- Wedge – Rising and falling wedges are popular reversal patterns that usually happen when the price is about to reverse.
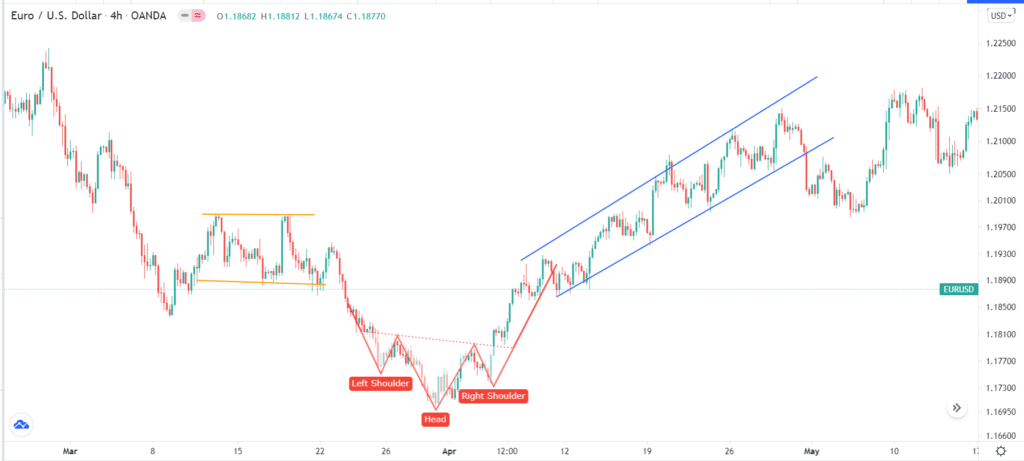
The chart below shows the EUR/USD with an ascending channel (blue), inverse head and shoulders pattern (orange), and a rectangle pattern (yellow).
Chart patterns in EUR/USD pair

There are other approaches to trade break and retest strategy. For example, when there is no well-defined pattern, you can use tools like Fibonacci retracement and Andrews Pitchfork. The Fibonacci retracement is made up of several mathematical levels like 23.6%, 38.2%, and 61.8%. It is drawn by connecting the lowest and highest points of a currency pair.
The Andrews Pitchfork, on the other hand, is drawn by connecting the lowest point and another significant low point. It has a middle line known as median and other lines that are used as support and resistance levels.
How to use the break and retest strategy
The basic idea of trading breakouts is that prices tend to start a new trend after moving below key support or above an important resistance level. For example, in a head and shoulders pattern, a new bearish trend is said to be started when the price moves below the neckline. Similarly, in an ascending triangle, a new trend is said to be started when the price moves above the resistance level.
Therefore, the first step of trading the break and retest strategy is to identify a chart pattern or place the charting tools like Fibonacci retracement and pitchfork.
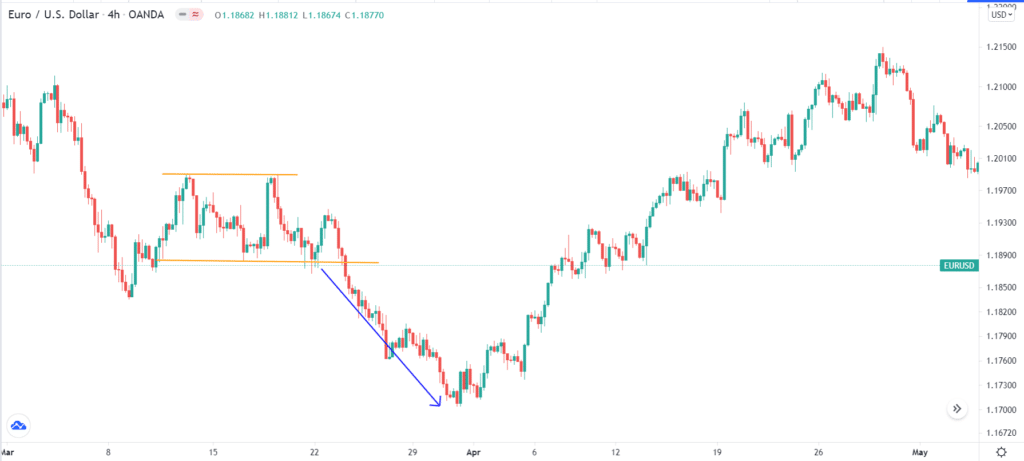
The next step is to wait for the initial breakout to happen. In most cases, the price will move above the resistance or below the support and then move back to the same levels. This happens as some traders exit their trades after the breakout. After retesting the support and resistance levels, the price tends to resume the original breakout trend. At times, however, the price tends to continue with the breakout trend. For example, in the chart below, the EUR/USD continued with a downtrend after breaking out lower.
EUR/USD bearish breakout

Therefore, the best approach to trading the break and retest is to wait for the breakout to happen and see the pair’s price action. If a new trend is formed without a retest, it is a good opportunity to buy (sell in case of a downtrend) and follow the trend.
Break and retest strategy example
If the breakout is short-lived, a good strategy is to place a buy or sell-stop at the top or bottom part of the breakout.
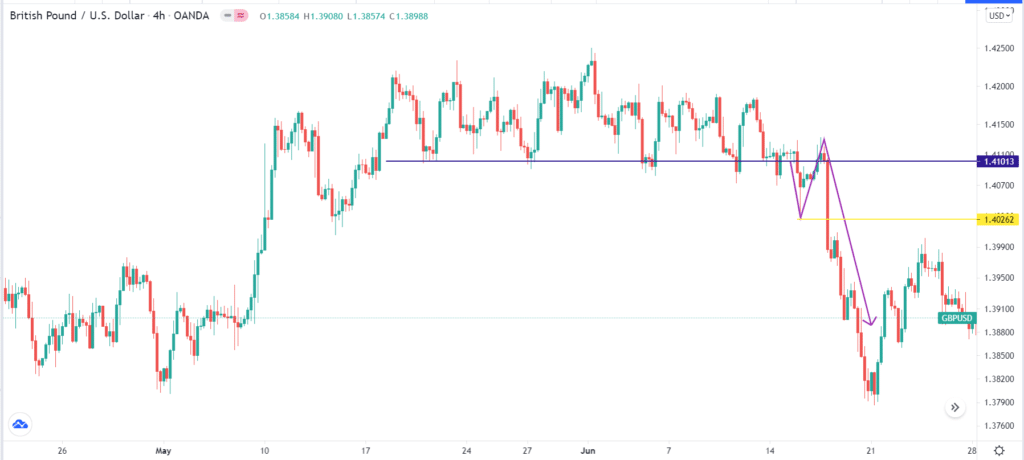
A good example is in the GBP/USD pair below. As you can see, the price found strong support at the 1.4100 level. It then made the first bearish breakout and dropped to 1.4026.
Break and retest example

The pair then resumed the upward trend and moved above the resistance and finally broke out lower. Therefore, in this case, a trader would have placed a sell-stop at 1.4026.
Summary
A break and retest is a good forex trading strategy that is also easy to use. It happens after the price forms a consolidation or a certain chart pattern. If you are new to the strategy, we recommend that you spend enough time practicing it in a demo account before you apply it in a real account.


Leave a Reply