Price action is a trading strategy that involves looking and interpreting chart patterns over time. It is a common strategy that is often used independently or together with technical and fundamental strategies. The approach is based on the idea that the most important determinant of the future price of an asset is the price itself. It is applied well in day trading, swing trading, and long-term trading. Let us look at the four most common price action strategies.

Candlestick analysis approach
The candlestick analysis approach is based on the ancient Japanese ideas of candlestick formations. The approaches were first used in the rice futures trading industry in the 19600s. In this price action trading strategy, traders look at the charts and the emerging patterns and then decide on whether to buy or sell an asset.
In most cases, traders use candlestick patterns to identify reversal zones. A reversal is a situation when a financial asset changes its direction. A bullish reversal happens when the falling price of an asset starts rising. Similarly, a bearish reversal is when the rising price of an asset turns lower.
Price action traders look at several types of candlestick patterns – hammer, engulfing, harami, doji, morning and evening stars, and shooting star, among others.
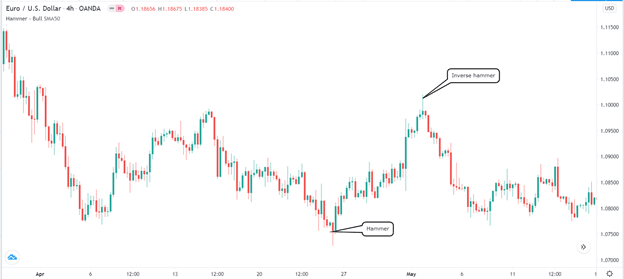
The hammer is one of the most popular bullish reversal patterns. It usually resembles a hammer, with a small body, a long lower shadow, and no or small upper shadow. The pattern happens when the price opens sharply lower but then bulls return, leading to a small body. The opposite of the hammer is known as the inverse hammer and is usually a bearish reversal pattern.
Hammer candlestick example
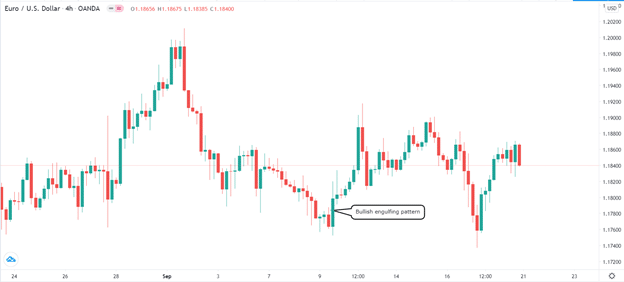
Bullish and bearish engulfing patterns are other popular candlestick patterns used in price action trading strategy. An engulfing happens when a small candlestick is fully covered by a bigger candlestick of the opposite colour. The chart below shows a good example of a bullish engulfing pattern.
Bullish engulfing pattern example
Channels in price action
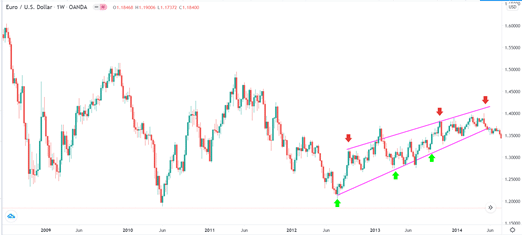
The use of channels is another popular price action trading strategy. For starters, a channel is made up of parallel resistance and support levels. A support is usually the lower side (or floor) while the resistance is the upper side (or ceiling) of the channel. A channel can be horizontal or diagonal.
A descending channel is usually bearish in nature and is drawn by connecting the lower and upper swings. Similarly, an ascending channel is usually bullish and is drawn by connecting the lower swings and upper swings.
There are two main strategies of trading channels in price action. First, you can play with support and resistance. This is where, in an ascending channel, you buy when the price tests the support level and short when it reaches the resistance level. You can see this in the chart below.
Channel trading strategy example
Obviously, the main risk of this strategy is buying at the support and then the price continues moving lower. The second approach of trading channels is to trade the breakout. A breakout happens when the price emerges from a channel and continues moving higher or lower.
To be fair, identifying a breakout tends to be relatively difficult even for experienced traders. A popular approach is known as the breakout with a build-up (BWAP). To do this, you need to combine a longer chart with the shorter-term chart. In the example above, we can use the daily chart to identify when a build-up is forming. As shown below, the build-up was bearish.
Channel breakout
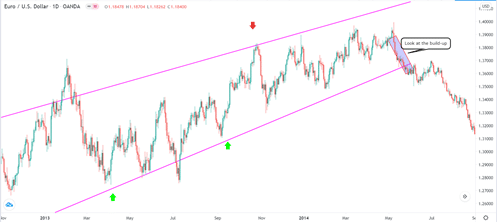
Chart pattern analysis
Analysing chart patterns is another price action trading strategy. The approach involves looking at the asset’s chart, identifying the patterns, and predicting where the price will move to next. There are several popular chart patterns such as triangles, wedges, double bottoms and tops, cup and handle and pennants. A closer look at these patterns can help you predict the future price of an asset.
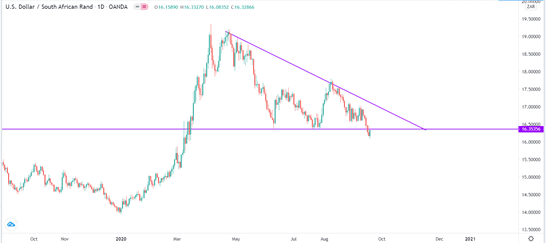
Triangles are popular chart patterns that can help you predict the direction of an asset’s breakout. A triangle can either be a descending, ascending, or symmetrical. A descending triangle usually starts with a major decline of an asset. After falling, the price starts to rise but loses the steam midway. It then drops and reaches the same level as the first support. It rises again but bulls fail to push it higher. It usually leads to a bearish breakout as shown below.
Descending triangle example
Flags and pennants are continuation patterns that appear when the price is in an upward or downward trend. A flag resembles a triangle pattern while a flag is made up of a small parallel channel. These patterns happen when there is indecision about the future of the trend.
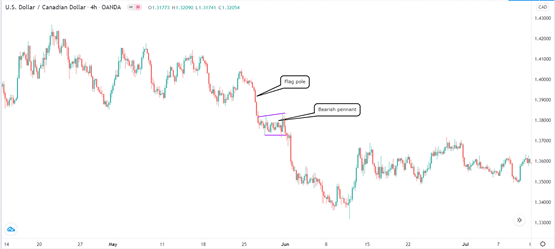
The general rule of a bearish flag is that the price needs to be in a strong downward trend, which is known as the flag pole. Also, the flag should have a small channel that later breaks out lower, as shown in the chart below.
Bearish flag pattern example
Trend following
Trend following is a price action strategy that is all about taking advantage of existing trends. The goal is to buy an asset whose price is rising and short the falling one. This strategy is based on the idea that the price of an asset will continue moving in a certain direction until it meets a strong resistance or support.
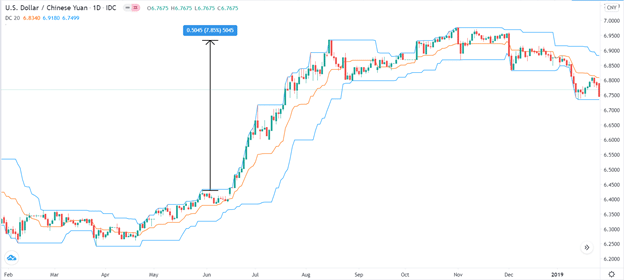
Traders use several approaches when using the trend following strategy. First, they use some technical indicators to predict when a pullback is about to happen. Some of the most popular indicators are moving averages and Donchian channels. The goal of these indicators is to identify levels where the price is about to make a pullback.
For example, as shown below, the upward trend remains provided that the price is along the upper side of the Donchian channel. A sell signal emerges when the price moves below the middle line of the channel.
Using Donchian channel in price action
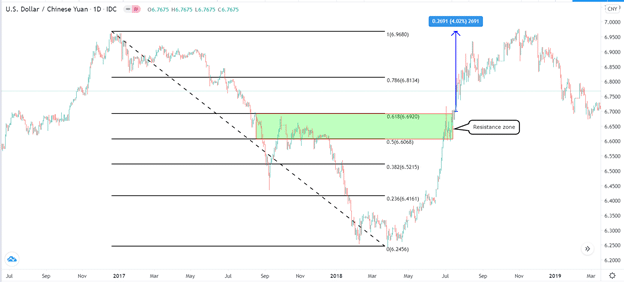
Second, they apply several tools to identify key levels of resistance or pullbacks. Some of these tools are the Fibonacci retracement and pivot points. The Fibonacci is drawn by connecting the previous important highs and lows. As such, when, during a rally, the price reaches between the 50% and 61.8% retracement, you are aware that a pullback may happen. This is shown in the chart below.
Price action using Fibonacci retracement
Final thoughts
Price action is a relatively simple trading strategy you can use in the financial market. Strategies like chart formations, candlestick patterns, and trend following are relatively easy to understand and spot. However, like all trading strategies, it requires a lot of learning and backtesting before you use it in the market.


Leave a Reply