To spot a probable reversal of price in the upward direction, traders use the hammer candlestick. Usually, this formation is trailed by a price upsurge and this is termed as confirmation. You can find this pattern on any span, such as daily, weekly, and single minute charts.
About The Pattern
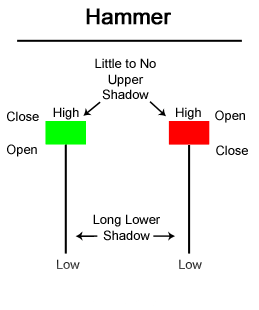
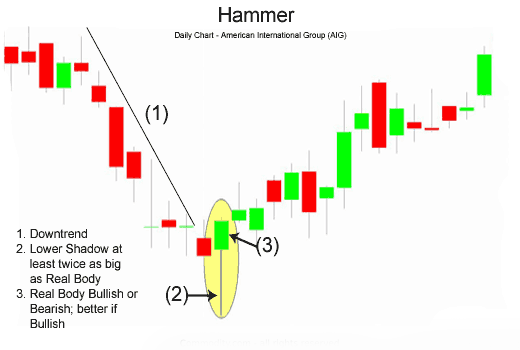
It is named so as it is in the shape of a hammer. The long lower shadow and small body are typical of this formation. To confirm the formation, the shadow requires to be twice the length of the body.
The variation in the closing and opening values is shown by the body and the shadow signals the low and high values for the specific span. The Hammer pattern is formed immediately after there is a decrease in the price. It reveals the entry of a seller during the span and that by the span’s end, the sale has reverted the value to its opening level.
Interpretation
Due to its occurrence after the weakening of an asset’s value, a hammer signals that the market is focusing on establishing a bottom. It reveals the readiness of sellers to generate a bottom together with an upsurge in the rate to show a possible value reversal.
All of these events occur in a single span during which there is a fall in the price after open but soon the prices regroup to end near the opening value. For a pattern to be declared as a hammer, it should appear like a ‘T’ and a reversal of price is possible only after confirmation happens.
This is when there is an upsurge in the value subsequent to the hammer. This signals a robust buying tendency. As a trader, you can maintain long positions or move out of short positions either during the hammer phase or after it is established. Stop-loss under the lower part of the wick in the formation is ideal for a long position.
Important Hammer Facts
When a hammer appears, you will find nearly the same rate for all the positions, namely high, close, and open. The formation turns bullish when the value of close and high are similar. This is a robust formation as the price was pushed beyond the opening rate.
If the high and opening values are similar, the pattern is moderately bullish as the price was not brought back to its initial rate. The long shadow reveals that the presence of demand and support is well established. And, after spotting the support areas, the rates were forced upward to the initial opening rate. The downward bearish trajectory was circumvented by this bullish move.
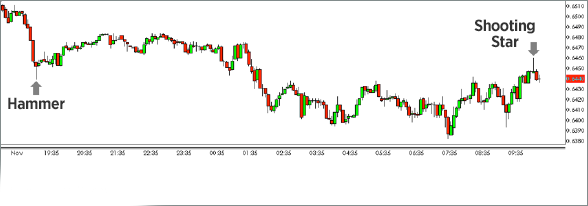
Hammer has other names too depending on its specific bearish or bullish bias. The shooting star denotes a hammer in an inverted form immediately following an uptrend. Hanging man denotes a hammer following an uptrend.
How Traders Benefit From Hammer
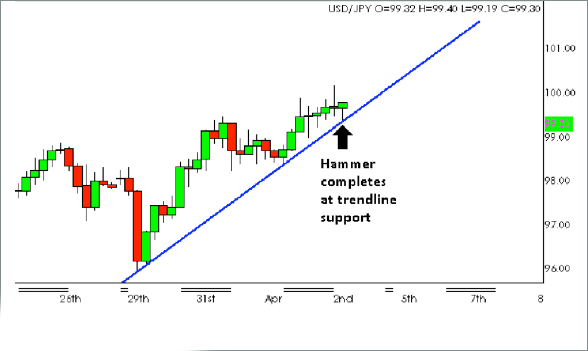
To visualize demand and support location, the hammer is ideal. When it occurs after a decline, it signals the end of the declining phase and the capitalization of short positions. But, it should not be used separately.
Price analysis and other technical indicators should be used along with this pattern to authorize the market position. For instance, a trader can wait for the increase next to the hammer to occur or a break in the trendline going downward.
Conclusion
This candlestick indicator suggests a change in the bearish or bullish trajectory. A hammer can help you strengthen or approve various reversal indicators, such as after a Doji or as a part of a tweezer pattern.
Often traders spotting the hammer, wait for the subsequent high open position instead of the finish of an earlier period for validation that the control lies with buyers. A longer shadow and higher volume during the specific span are further confirmation points to note.


Leave a Reply